Unchanged Issues: The data column everyone ignores DOES have value
Considering the vastness of an entity like the stock market which aggregates millions of decisions on the part of millions of participants, resultant price movements, or non-movements, necessarily carry valuable information (you might all it the ultimate “big data” mechanism). This includes seemingly useless or random data series. Take the tally of “Unchanged Issues”, for example. Most observers presumably never even glance at that data column when perusing their source of choice for market statistics. However, Unchanged Issues can, at times, reveal information about the collective emotional state of investors.
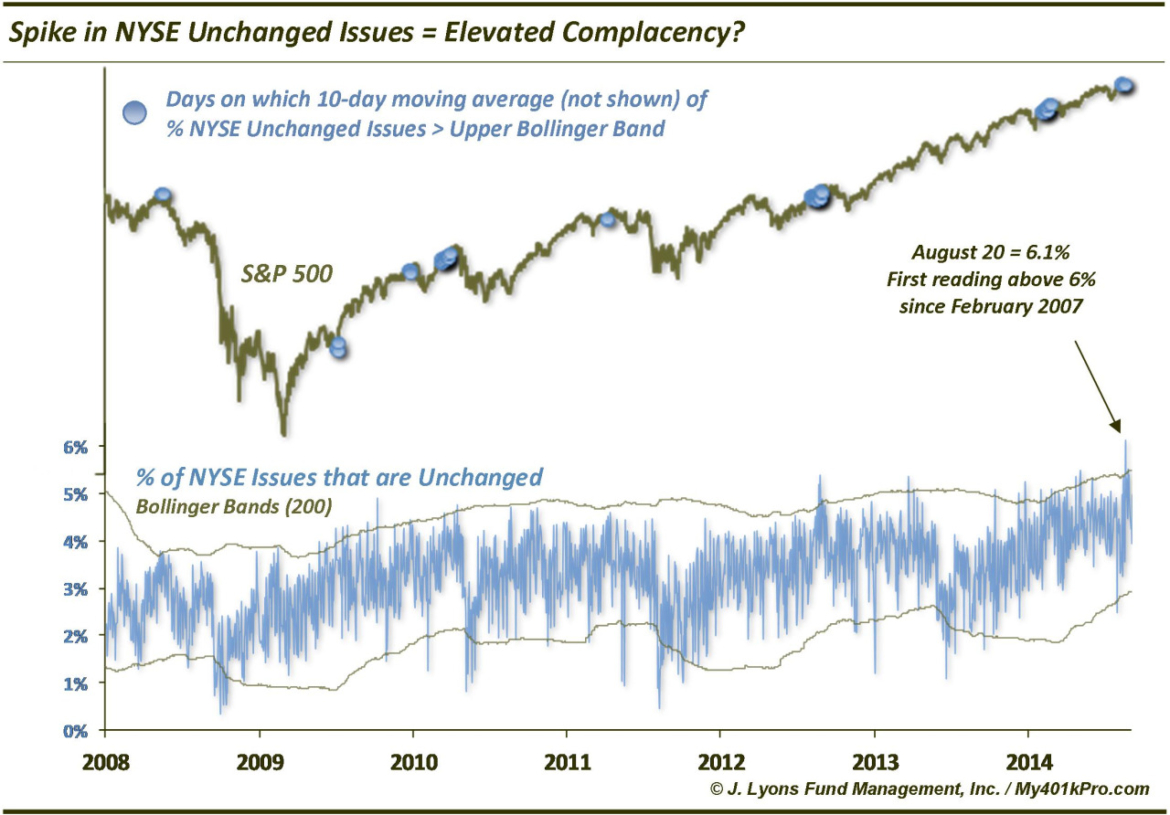
Specifically, we have observed that the level of Unchanged Issues tends to rise as markets rally, often reaching some measure of extreme near tops. We would surmise that this has to do with rising complacency that is present near market tops (in varying degrees depending on the significance of the top). As long as the market seems to be on good footing, there is relatively less concern and interest, at least in the most illiquid or inactive stocks. Obviously, an exception to this tendency would be stocks caught up in the bubbly or high profile sector at a given time.
Conversely, when stocks are selling off, it can create more of a sense of urgency on the part of traders (or investors) to “tend” to their positions. And the worse the sell off, the more urgency is created. This heightened sense of awareness in periods of stock market declines fits with scientific studies that have found that “fear” is a much stronger emotion than “greed” (a finding that we would definitely concur with from our own experience). As a result, more action tends to be taken (out of fear) when stocks are selling off than when they are rallying (out of greed).
Applying this observation (or truth?) to current circumstances would lead to one conclusion: investors are more complacent than they have been in a very long time. On August 20, the % of NYSE issue that were Unchanged on the day reached 6.1%. This was the highest daily % since 2003 and the first time it reached over 6% since February of 2007.
When smoothing out the data by using a 10-day moving average of the Unchanged Issues, we find that the series is still at the highest level since very early in 2004. By applying Bollinger Bands (200-day look-back), we can attempt to ascertain on a dynamic basis when the series reaches high or low extremes.
Since 2008, in particular, moves by the 10-day average of NYSE Unchanged Issues above the upper Bollinger Band have been relatively accurate markers of high extremes in Unchanged Issues and a complacent, or overbought, stock market. Unchanged Issues gave such signals leading up to intermediate-term market tops in May 2008, January and March 2010, April 2011 and August 2012. It also gave false signals in July 2009 when the market was still emerging from the bear market and February of this year so the indicator is not perfect.
With the immense amount of input continuously pouring into the stock market, the significance of seemingly insignificant data series should not be overlooked. This includes the level of Unchanged Issues on the exchanges, which can be a decent indicator of overall investor complacency when at relatively high levels. Currently, Unchanged Issues are at their highest levels in 10 years. While this may not be the most alarming of all the intermediate-term concerns we have pertaining to stocks at this time, we would consider it a negative for the market.


