Is the duration of the small cap divergence a concern?
We have commented on many occasions about the importance of broad participation of stocks and sectors on the health and sustainability of broad market rallies. Sure, at times only a few market sectors seem to be carrying the load in a “thin” rally. At other times, “leadership rotation” is the buzzword as different stock segments take turns leading the way. This rotational dynamic has characterized much of the rally in stocks during 2014 as former leaders have fallen by the wayside and new leaders have stepped up. The problem is, eventually these thin or rotation based rallies run out of leaders and that leads to the end of the rally.
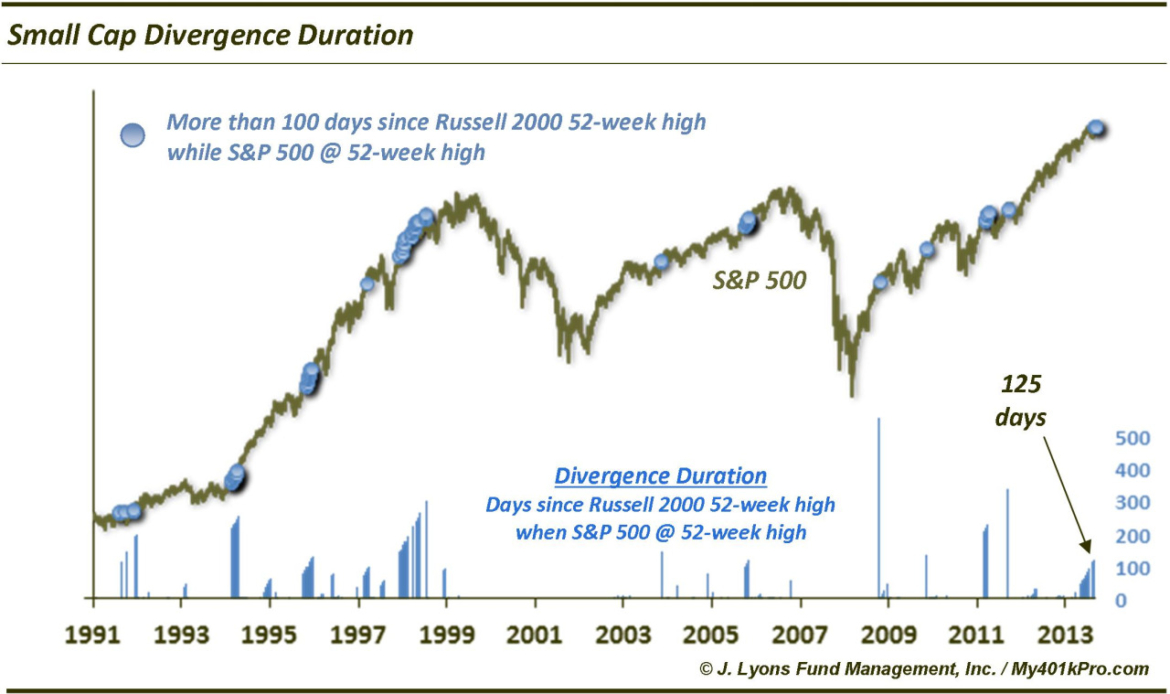
Of course, as we discussed the other day regarding the lack of 52-week highs, these types of divergences can last for many months with the major indexes continuing to gain. The challenge is to try to identify if there is a “breaking point” at which the divergence exerts its pressure on the market. It is in that vein that we present our Chart Of The Day looking at the divergence in the Russell 2000 Small Cap Index. Specifically, we examined the length of the divergence in which the S&P 500 is at 52-week highs yet the Russell 2000 is not.
As the chart indicates, at the most recent 52-week high in the S&P 500 (on 9/2), it had been 125 days since the Russell 2000 had made a new high itself. Is that extreme? And is it a cause for concern? Well, there are basically two ways this divergence can resolve itself. The Russell 2000 can catch up to the S&P 500 in new high ground or it can pull the S&P 500 down, causing a correction (or worse), refreshing the market before the cycle starts over again.
Looking at the history of the Russell 2000 (since 1991), this is the 12th divergence lasting 100 days. In many of the previous instances, it was a case where the market was emerging from a decline or long stagnation and the S&P 500 simply made a new high first before the Russell 2000 caught up in fairly short order. This was the case in 1992, 1995, 2004, 2006, 2009 and 2010.
In late 1996, the divergence reached 159 days and eventually pulled the S&P 500 down into a very mild correction in the beginning of 1997. This refreshed the market and provided a springboard for a big rally later that year.
In March 1998, the divergence lasted exactly 100 days before the Russell 2000 caught up and made a new high. It was a short-lived new high, however, as the market reversed shortly after and suffered a sharp bear market in the second half of 1998.
In 1999, the divergence reached over 300 days in what might be called the “great divergence” as large caps rallied strongly through early 2000 even as most stocks were still suffering through bear markets. The market finally did succumb to the divergence pressure and corrected from July through October of 1999 before the blow-off move into 2000.
The last two instances came in 2012. These were sort of a hybrid of the two resolutions as the S&P 500 was able to make slight new highs in April and September while the Russell 2000 did not, resulting in divergences of 234 and 344 days. Initially following each instance, the market corrected some 8-10%. Ultimately, each index moved to new high ground in early 2013.
So 6 of the divergences of 100 days or more resulted in the Russell 2000 catching up to the S&P 500 at new highs. 4 of the others resulted in mild-moderate corrections before the market resumed its advance. Only in 1998 did the market suffer major damage following the divergence. So historically, it does not appear to be as much of a worry as commentators often suggest.
So what will transpire from the current iteration? The general odds say there is not a whole lot to worry about from the divergence. That said, if there were any precedents that most closely resemble the current divergence, it would probably be either 1996 or 1998. These long-duration divergences came after long rallies, not after emerging from declines. The 1996 occurrence led to a brief blip lower before accelerating in a massive move to the upside. The 1998 instance preceded a brief blip higher before a significant 20% decline. So, judging by these two binary precedents, the divergence has a 50-50 chance of a very positive or very negative resolution.
What is our takeaway? Long-duration S&P 500-Russell 2000 divergences have not led to the calamitous types of events one often hears warnings about. 10 of the 11 such historical precedents have led to only moderate hiccups in the market. The two most similar to our present divergence, however, have had split results, including a bear market. While we have no way of knowing the ultimate outcome, our guess, given current conditions, is that the odds of a poor outcome are probably closer to 1 in 2 than 1 in 11.


