52-Week Highs Struggling To Reach 52-Week Highs
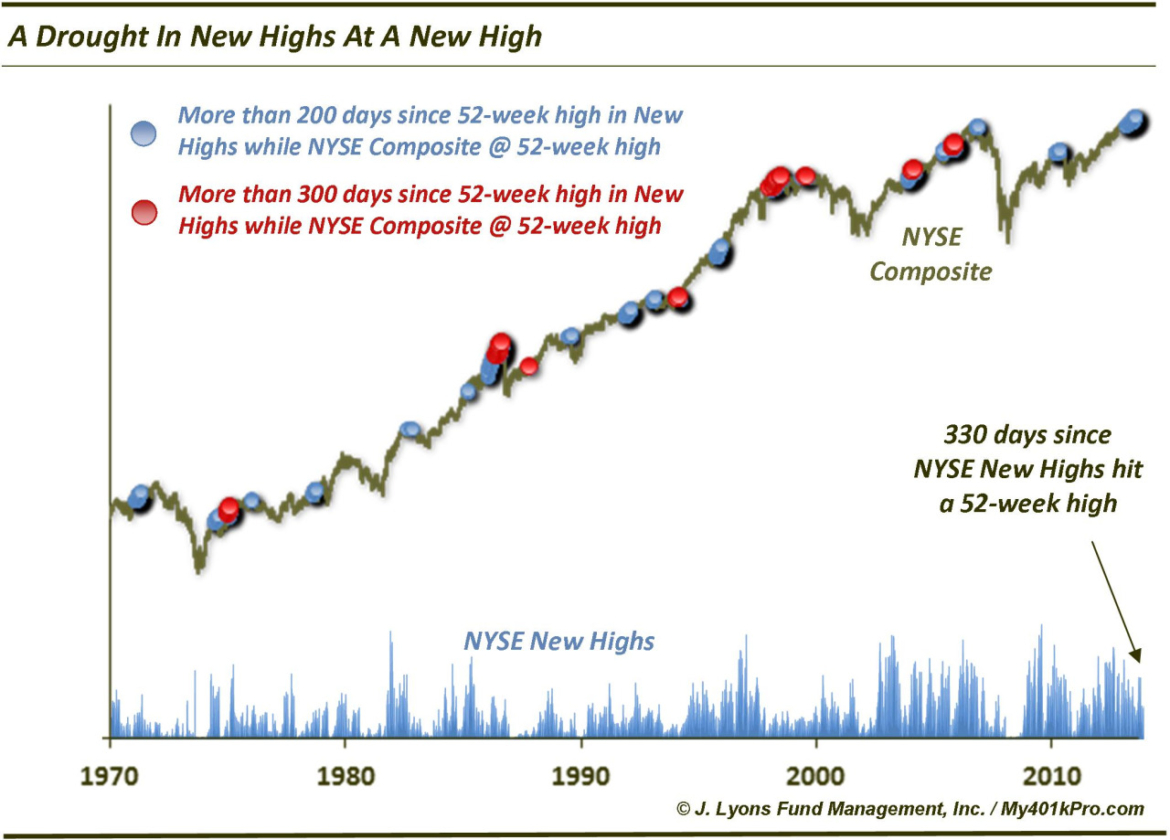
The grand daddy of all breadth indicators, the NYSE advance-decline line, recently made an all-time high. This is probably the most significant breadth indicator and, since it almost always peaks before the market, this is an intermediate-term positive for the market. That said, on a more micro scale, the market internals have been systematically eroding for much of the past 12 months, even as the major averages continue to hit all-time or 52-week highs. One such example can be found in the number of NYSE stocks making new 52-week highs. In fact, this figure has not made a new 52-week high itself in 330 days and is the subject of our Chart Of The Day.
The notion of divergences is often overplayed in technical analysis. Confirmation by every sort of indicator to a new high in an average is almost never going to happen. Often times, the indicator, i.e., new highs simply takes a few days or weeks, etc. to catch up. Furthermore, there typically are no triggers involved when considering divergences. And considering divergences can last for a very long time, it can be painful for those relying on them for a trade.
That said, sometimes divergences reach extremes that are either out of the norm of standard behavior or have historically signaled key junctures in the market. The drought in NYSE New Highs hitting a 52-week high is possibly hitting such a point, in particular with the NYSE Composite near a 52-week high itself.
As mentioned, New Highs have not hit a 52-week high in 330 days now. While that is not terribly rare – there have been 14 such streaks since 1970 – it is rare with the NYSE Composite sitting near a 52-week high. New Highs have only reached 300 days without marking a 52-week high 6 times when the NYSE Composite was at a New High. These streaks preceded cyclical peaks in 1976, 1987, 2000 and 2007. However, one such streak also ended in 2005 without much of a cyclical decline. Additionally, another streak ended in 1995, not with a market decline but with NYSE New Highs “catching up” to the market and hitting a new high themselves. Overall, however, the aftermath of such conditions have not been pretty.
Following days on which the NYSE Composite was at a 52-week high yet NYSE New Highs had not been at a 52-week high in over 300 days, the average 6-month return was -0.8% versus +3.5% after all days. Furthermore, the average 2-year return following those conditions was just +0.6% (with an average drawdown of -19.7%) versus an average return of +12.5% after all days.
Bear in mind that the last time the NYSE Composite closed at a new high was on July 3. At that point, the 52-week high drought was at 291 days, so this statistic has not technically been triggered. However, conditions are essentially the same now. Besides, streaks reaching 200 days have even marked key cyclical or intermediate-term tops including in October 2007 and May 2011. Additionally, as noted the difficulty with divergences is they can persist…indefinitely. The longest drought in New Highs hitting a 52-week high was 720 days, ending in August 2000. That was about 200 days longer than the next longest streak, however.
Therefore, absent a resurgence of new 52-week highs, the odds are growing increasingly high in favor of a significant drawdown in the forthcoming months and years.


