Historic shift in volatility from small to large caps
There has been an abundance of discussion recently regarding the relative performance of large caps to that of small caps. Specifically, speculation has focused on the significance of the large cap outperformance for most of the past 6 months, as well as the small cap outperformance in just the past week. The dichotomy between the two groups, and its 180 degree shift last week, is perhaps best illustrated by today’s Chart Of The Day.
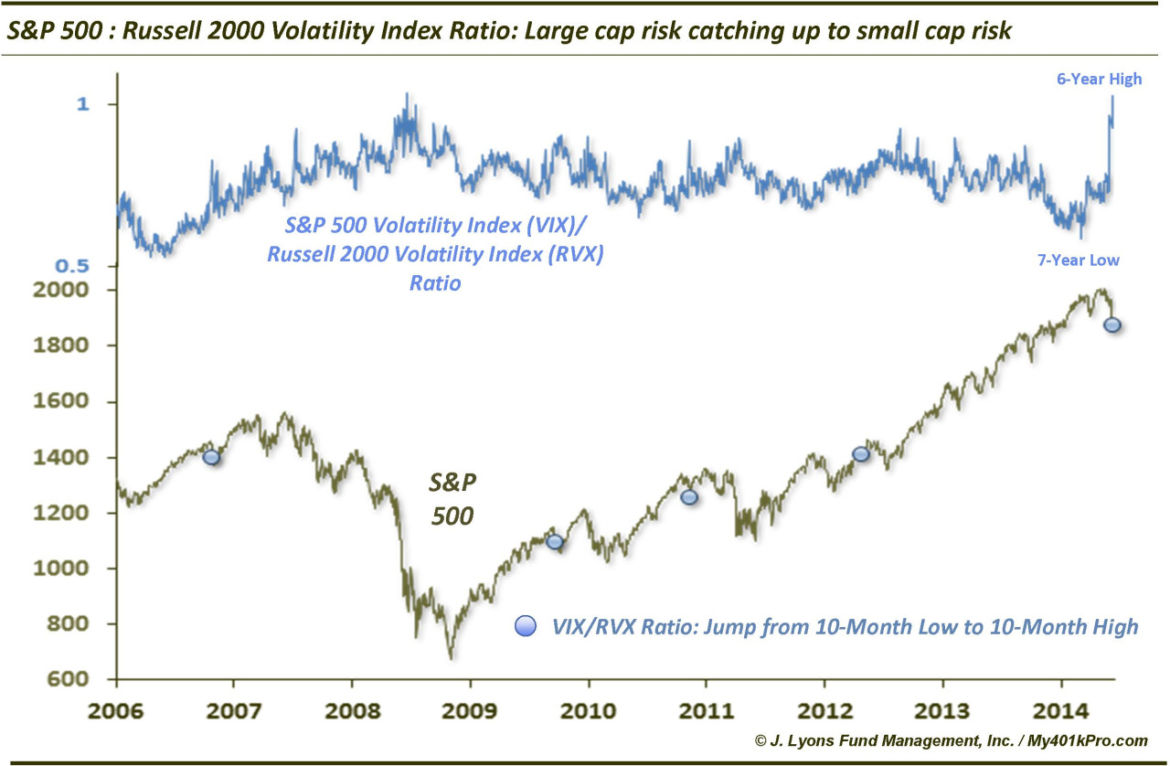
It shows the ratio between the S&P 500 Volatility Index (VIX) and the Russell 2000 Small Cap Volatility Index (RVX). As recently as July, the ratio sat at almost 8-year lows – not surprising considering both the record low volatility rally in the large caps this year and the struggles in the Russell 2000 since early in the year. Things can change quickly in this market, however. Last Wednesday, the VIX/RVX ratio spiked to a 6-year high. Furthermore, the reading was the 2nd highest on record, just behind October 22, 2008.
So what is the significance of this? For one, it illustrates the shifting risk focus from small caps to large caps. For those arguing that the small cap underperformance was a warning sign and would eventually be resolved by the large caps “catching down” to the small caps, this has been at least temporary validation. The spike in this ratio, and the reluctance of the small caps to sell off last week, was also likely a sign that the small cap selling had run its course, at least in the short-term.
Besides telling us what is happening, does the shift in this ratio give us any clues as to what is to come? Looking historically, we identified 4 other times since the origin of the RVX data (2006) when we saw a similar turnaround. None of the precedents were as extreme as the current example so we relaxed the parameters a bit. What we looked for were times when the VIX/RVX rapidly went from a 10-month low to a 10-month high (we chose 10 months because the obvious turn higher in 2007 came before we had 12 months of data on record and we wanted to include it). The 4 precedents came in February 2007, January 2010, March 2011 and August 2012.
A couple general takeaways from these prior events may be instructive to our present situation. First, besides the 2012 event, the others occurred into short-term weakness. Like our current case, large cap weakness was in some ways “catching down” to the lagging smaller cap area. The result, in those 3 instances, was a fairly significant bounce in the short to intermediate- term. That is the good news. The bad news is that all 4 of the precedents eventually led to a significant intermediate-term sell off. Those events included the flash crash, the 2011 bear market, the fall 2012 decline and, of course, the 2007 top.
We don’t like to read too much into one indicator, and especially not an event with just 4 precedents. Furthermore, the current markets – and markets in general – do not lend themselves to the notion of certainty. However, if there is any guidance suggested by the development in the VIX/RVX ratio, it would likely be this: markets may be near a short-term low; however, a dramatic shift in its risk profile has occurred and stocks are likely at risk of a more serious, longer-term correction after a bounce materializes.
At a minimum, some seismic shift has occurred in this market as demonstrated by the historic shift in the ratio, even if we do not yet know what it is.
________
More from Dana Lyons, JLFMI and My401kPro.


