International Stocks Testing Major Support
On October 6, our Chart Of The Day noted the 52-week low in the MSCI EAFE Index (Europe, Australia and Far East). Probably the most widely followed international index, the stealth new low in the EAFE caught many folks off guard. While Hong Kong and core Europe’s declines were just starting to get noticed, less obvious but more devastating declines in Australia and within the PIIGS and Latin America (not included in the index) were causing major negative waves throughout the global equity landscape. The new low in the widely followed EAFE was a wake-up call that something more serious was underway than the minor pullbacks of the past few years.
We ended the post with a mix of good news and bad news:
The good news is that significant support lies around 1740, signifying Fibonacci Retracement support from the lows in 2009, 2012 and June 2013. The bad news is everything else that we mentioned above. Additionally, if the upward momentum in the U.S. finally succumbs to a similar halting, more pressure could be heaped upon the international markets.
At a minimum, a 52-week low in the MSCI EAFE is a concerning development for worldwide equity markets — especially when investors actually notice it.
Well, as we know now, the U.S. markets did succumb to weakness and folks did take notice of the international markets hitting new lows and the global selling pressure intensified. In just 8 days since that October 6 post, the EAFE dropped another 16% (at yesterday’s intraday low). The good news is that the index has reached, and in fact slightly exceeded, the Fibonacci support levels we mentioned around the 1740 level.
The EAFE closed yesterday at 1715, under the support level we laid out. However, as we have mentioned several times recently, during a waterfall type of decline, prices can overshoot support levels, even the most significant ones. And this is one level we would deem significant.
We have mentioned Fibonacci Retracement levels many times. In our view, the best support (or resistance) comes when multiple Fibonacci levels, stemming from different major inflection points, line up together, for example, the 61.8% and 38.2% retracement levels. In our view, these are the two most significant levels and when they line up together, they offer very strong support. And even stronger support comes when the third most important level, 23.6%, lines up as well. That is what is in play now with the EAFE.
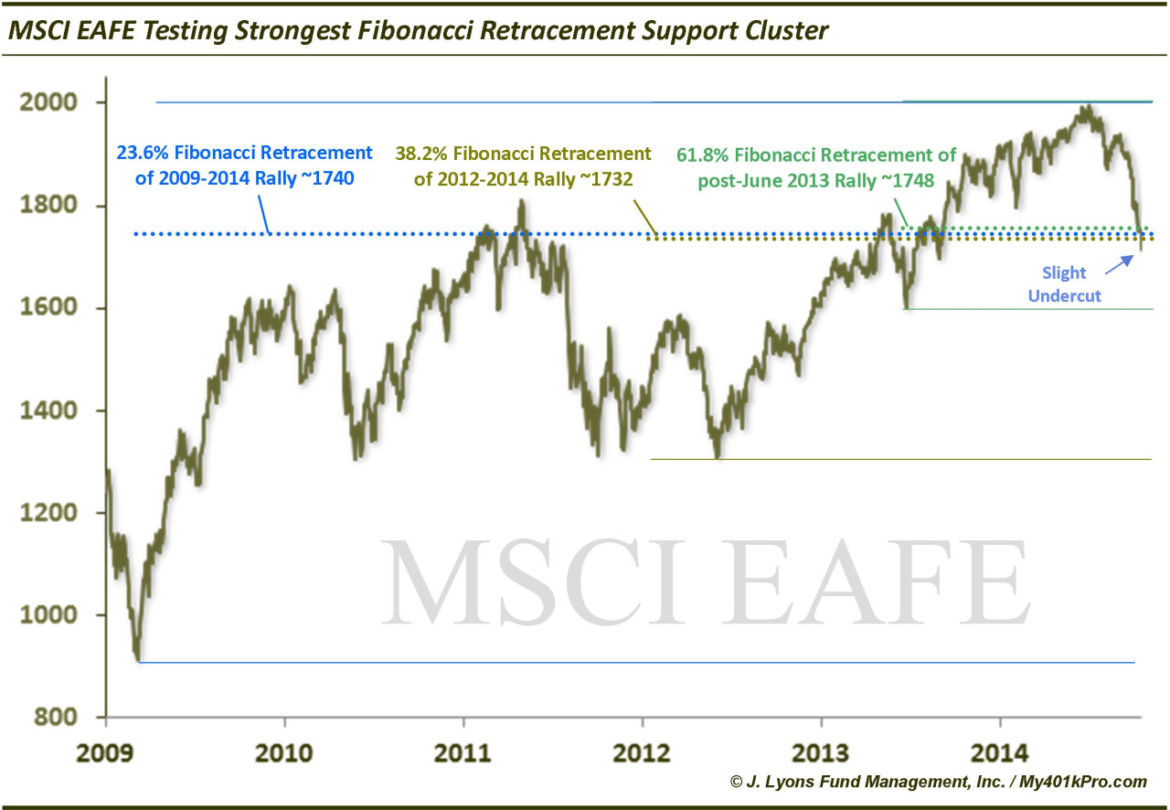
Specifically, here are the three Fibonacci Retracement support levels:
- 23.6% Fibonacci Retracement of 2009-2014 Rally ~1740
- 38.2% Fibonacci Retracement of 2012-2014 Rally ~1732
- 61.8% Fibonacci Retracement of post-June 2013 Rally ~1748
We are not fans of trying to catch falling knives. However, when we do, it is only into significant support. The MSCI EAFE is testing the strongest possible cluster of Fibonacci Retracement support. If it can reclaim the 1740ish level, it could set the index up for a significant rally, at least in the intermediate-term.
________
More from Dana Lyons, JLFMI and My401kPro.