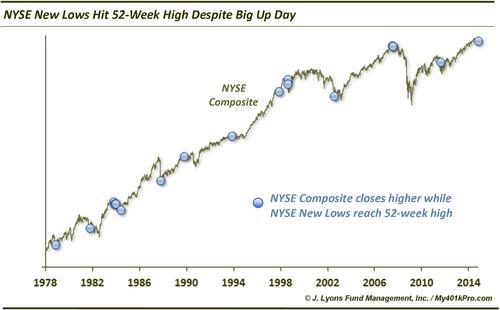
Despite yesterday’s rally, New Lows made 52 week highs
In the midst of the moonshot stock rally yesterday, something unusual happened. The number of New Lows on the NYSE (and Nasdaq) expanded to a 52-week high. After triple-checking the data to make sure we weren’t crazy, considering the Dow was up nearly 300 points, we wondered how rare this feat was. As it turns out, it’s darn rare. Since 1970, the number of NYSE New Lows set a 52-week high on 147 days. Before yesterday. the NYSE Composite closed higher on only 17 of those days.
So is there any common thread among the 17 occerrences? They of course were all unique circumstances but, in general, they tended to follow a similar template:
- followed a downdraft in the market
- occurred during a sizable reversal day up
- were part of at least a temporary bottoming process
- was later retested (whether in days or months)
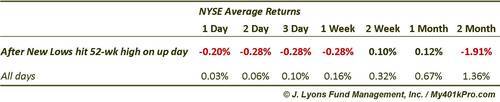
NYSE Composite returns following such days, on average, tended to be worse than typical from 1 day out to 6 months.
Of course, the market did not follow an identical path following each of the occurrences. Some performed better in the short-term, some better in the long-term. Accordingly, we zoomed in on the results in an effort to try to identify situations among the 17 prior days that best fit yesterday’s circumstances.
One differentiator was in the daily gain in the NYSE on the days in question. Yesterday saw the NYSE gain over 1.5% on the day. Therefore, we looked at each of the 17 days that exhibited gains of at least 1% on the day. There were 5 such days prior and, while this is even a smaller sample size, the results following these days were much more positive.
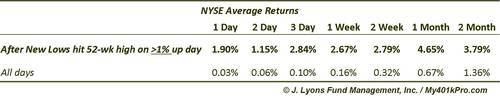
Well, those returns look better. So is this an all-clear sign? Not so fast. The 5 days reflected in the table above exhibiting outsized gains on the day mostly occurred after much more significant selling pressure (e.g., October 1987, October 1997, July 2002) than we have seen in our present circumstance. Therefore, they were a part of more significant bottoms, in duration and in magnitude.
One sign of the magnitude in selling pressure preceding these 5 occurrences was in the number of New Lows occurring on the day. The average number of New Lows on those 5 days was 641. In contrast, yesterday recorded 288, relatively few by comparison. Therefore, we categorized the 17 days by the number of New Lows occurring on the day and measured the results.
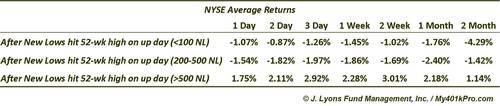
As the table shows, results following these days that recorded more than 500 New Lows (5 occurrences) showed excellent returns in the short-term. This demonstrates the “washed-out” conditions at those times. Conversely, returns following days with less than 100 New Lows (5 occurrences) showed poor returns, especially 2 months out. Lastly, following days with between 200 and 500 New Lows (7 occurrences) like we saw yesterday showed the worst returns going forward, at least up to 1 month.
Therefore, although the market bounced strongly yesterday and closed significantly higher, the number of New Lows suggests that conditions may not be “washed out” enough to yet support a significant bounce as shown in the 2nd table. Indeed, as we are witnessing today, similar conditions have usually brought more selling pressure up to a few months.
We will reiterate that, should the market bounce somewhere in here, prior occurrences (almost unanimously) suggest that the initial low will be retested at some point. The more significant the bottom, with the greater number of New Lows, has led to larger bounces for up to several months before a retest. The more minor bottoms with fewer New Lows have led to bounces of a few days or weeks before a retest.
Then again, it’s always possible the vaunted V-Bottom comes from out of nowhere to save the day. However, today is not following that playbook that has existed for the past 2 years.
________
More from Dana Lyons, JLFMI and My401kPro.


