High-volume breakdowns lead to nearby bottoms — after a flush
Yesterday, the S&P 500 accomplished a rare feat. It touched a 6-month low (before recovering) on the heaviest volume day in a year on the NYSE (not including option expiration days).
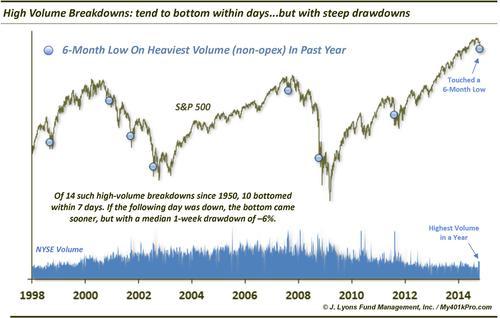
Since 1950, such a high-volume breakdown has occurred just 14 other times, not including a few clusters of instances. The action of the stock market after such breakdowns has varied so merely looking at average returns is not the most productive method of analyzing the events. Nevertheless, here are said returns.
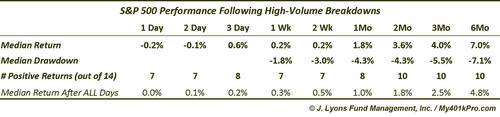
As the table shows, the returns appear to be binary, with roughly half of the occurrences showing positive returns out to a month and half of them negative. The interesting thing is that the instances showing positive returns are not the same over those time periods. Some of the occurrences showed immediate positive returns over the next few days before dropping in the weeks following. Likewise, some showed further selling for several days before forming at least a short-term low and bouncing.
A couple instances, October 1987 and October 2008, saw big rallies over the following 2 days, +15% and +11% respectively. That does not appear to be in the cards for today. With the futures down sharply at the moment, let’s focus on those that saw further selling the next day. Here is the performance of those 7 dates.
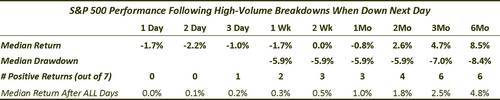
Naturally, the short-term returns, and especially drawdowns, are much worse when the breakdown days are followed by immediate weakness. The median 1-week drawdown was nearly -6%. This suggests that should the S&P 500 close lower today, the near-term risk of further large declines over the next few days is substantial.
On the positive side, the near-term weakness did not seem to effect the intermediate-term performance. Indeed, by 2 months later, the median return was better than that after all days. And by 3 months later, 6 of the 7 were higher by almost double the typical index return.
One other silver lining is that, following instances that saw immediate further selling, the market tended to bottom sooner. 6 of the 7 formed a short-term low within 7 days and 5 of them within 4 days. The instances that bounced the following day tended to eventually fail before finding a bottom. While 2 bottomed that very day, the other 5 took between 6 and 14 days to bottom.
Interestingly, other than the 1987 crash, the other instance that bottomed on the breakdown day was August 16, 2007. Bulls were hoping that that day would serve as a template for yesterday. The similarities are obvious, including the big intraday reversal (although, as we posted recently, such reversals are not reliable as longer-term turns.) With this morning’s selling pressure, we do not appear to be following that template.
The other reason to hope that August 2007 may serve as a template was its proximity to the 52-week high. Other than the current case, it was the only instance of a high-volume breakdown that came after the S&P 500 hit a 52-week high sometime within the past month. Again, that template does not appear to be panning out today.
What’s the main takeaway? These breakdowns tend to see further weakness in the days following, often significant weakness. This is especially true when the following day is down as the S&P 500 appears to be heading today. However, once the short-term selling pressure subsides, the market has tended to put in a short-term bottom within a few days or weeks. Such a bottom has led to strong, even above-average, intermediate-term rallies.
________
More from Dana Lyons, JLFMI and My401kPro.


