Largest Monthly Reversals In Stock Market History
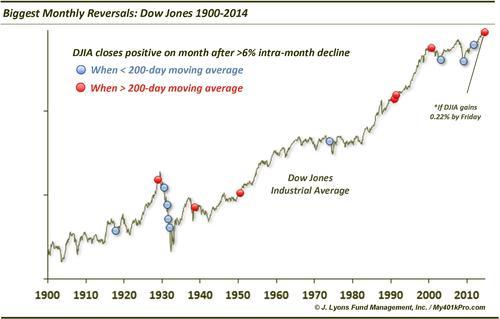
Piggybacking on yesterday’s post about October’s clutch tendency to launch rallies, today’s Chart Of The Day looks at this month’s big bounce off its near 7% intra-month loss. At the risk of being a jinx, should the Dow Jones Industrial Average gain another 0.22% by Friday, it will complete a rare positive monthly reversal.
How rare? Since 1900, there have been just 15 months in which the Dow lost at least 6% at one point before closing the month at a gain. That represents just a hair more than 1% of all months. Additionally, the 15 reversals equate to just 6.5% of all months that showed an intra-month decline of at least 6% at some point. Here is a chart of the 15 reversals since 1900.
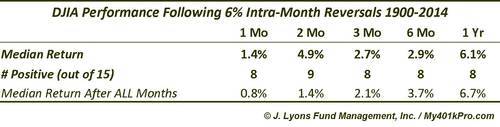
So how has the Dow reacted following these big monthly reversals? In general, short-term returns were above average on a median basis out to 2 months. After that, median returns were roughly in line with the typical median after all months. However, the percentage of positive returns ran at only about 50% for all periods, lagging the typical percentages. Here are the statistics for all 15 reversals.
So big deal, right? Returns going forward were roughly in line with all months. However, after digging a little deeper, there was quite a dichotomy between the various returns. And the factor differentiating future returns among the sample seemed to be whether or not the Dow was in a bull or bear market at the time. For sake of this study, we determined a bull or bear market based on whether the Dow was above or below its 200-day moving average at month end. Here are the results when separating the sample into bull (>200 MA) or bear (<200 MA) markets.
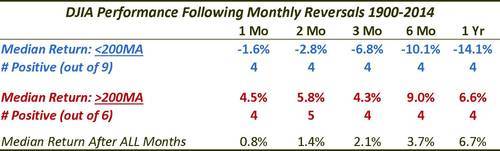
Reversals that took place during bear markets, showed very poor median returns going forward, from 1 month to 1 year. These instances included several that occurred during the early-1930’s in the midst of the post-1929 collapse. Those obviously led to dismal returns. A few others occurred at the cyclical lows in 2003 and 2009 and the significant low in 2011. These led to obviously better returns.
The bull market occurrences more closely resemble our present case, i.e., 2 years into a straight up run in the Dow within the confines of a 5-year cyclical bull market. Returns following other bull market reversals were much higher than normal out to 6 months. However, after that strong performance, gains actually dropped by one year out. One reason is that a few of the dates came in the lead up to secular or at least cyclical tops. Thus, after another intermediate-term rally following the reversal, the market top was put in.
The dates of those 6 bull market reversal months were December 1928, September 1938, July 1950, January 1991, August 1991 and October 2000.
Assuming the monthly reversal comes to pass on Friday, it certainly would appear to be a positive for the stock market going forward, particularly in light of yesterday’s post on October’s bottom tendencies. Historically, performance following such reversals has been mixed, although on occasions when the Dow was above its 200-day moving average (which is the case today), returns were very solid out to 6 months. After that, the the market has, on occasion, formed major tops. Given our present circumstances, that possibility cannot be ruled out.
________
More from Dana Lyons, JLFMI and My401kPro.


