(Mr.) October living up to clutch month reputation
In the equity investment world, the month of October has typically received a bad rap. Much of it deserved, given the number of ignominious events that occurred during the month, including the crashes in 1929, 1987 and 2008, to name a few. Indeed, since 1900, there have been more 6-month lows made during October than any other month, by a wide margin.
However, less recognized is the month’s proclivity to form a durable bottom from such lows. The fact is that lows made during October have held more often over the subsequent 6 and 12 months than any other month. So, in deference to Reggie Jackson who was given the moniker “Mr. October” on account of his post-season heroics, we would dub this month the “Mr. October” of the equity world.
This chart shows the number of years since 1900 that a 6-month low was made during each month in the Dow Jones Industrial Average. Additionally, it shows how many times that low held over the subsequent 6 and 12 months.
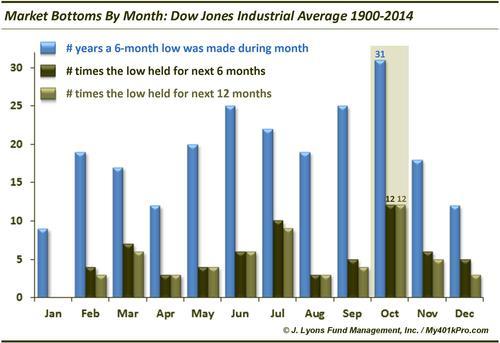
As the chart indicates, of the 31 years (32 as of this year) since 1900 that a 6-month low was made during the month of October, that low held over the following 6 and 12 months on 12 occasions. Furthermore, the higher number of bottoms formed is not simply due to the overabundance of lows during the month. October has also produced bottoms at a higher rate than almost any other month. Here are the raw numbers.
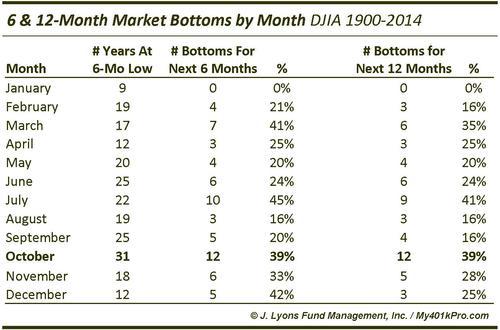
At 39%, October’s lows have held over the following 12 months more often than any other month besides July. And on a 6-month basis, October lows have held more often than any month besides March, July and December. So perhaps, July shares the honor of “clutch month” with October. However, given the quantity of October bottoms, we’ll still give the nod to this month.
Lastly, given the fact the Dow is 6% off of the lows, is the likelihood of holding the low over the next 6 and 12 months elevated? Intuitively, certainly the more buffer above the month’s lows the better as far as those prospects are concerned. However, interestingly, that buffer has not been a significant tell, historically, as to whether the October lows will hold going forward.
The 12 Octobers that set a low for the subsequent 6 and 12 months averaged a close of 8.5% above the monthly low. 5 of those 12 Octobers saw the Dow close at least 6% above the mid-month low (equaling the Dow’s gain as of yesterday). The 19 Octobers whose low failed to hold up over the subsequent months closed the month at an average of 8.1% above the intra-month low, with 7 of the 19 seeing at least a 6% jump from the October low to its close.
So based on the fact that we have already rallied smartly off of the October lows does not improve the odds of that low holding up for 6 or 12 months going forward, at least from a historical context. However, bulls can take comfort in October’s clutch tendency to put in at least a sustainable intermediate-term bottom. Nothing’s guaranteed, but even the original Mr. October would have taken a .390 batting average.
________
More from Dana Lyons, JLFMI and My401kPro.


