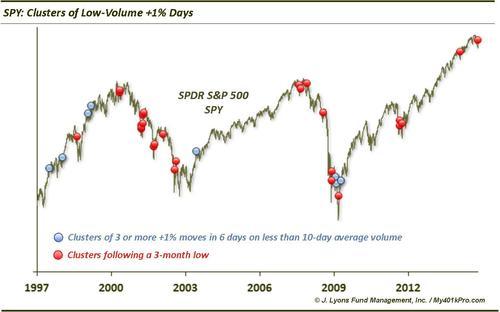
Sharp rallies on low volume a short (and long?) term concern
We’ve mentioned on numerous occasions that we do not include volume as a significant input into our market analysis. So why 2 posts in three days about the low volume? We’ll repeat what we said in our Wednesday piece, Low volume in Nasdaq bounce a red flag: "we have found little evidence that the level of volume has a meaningful impact on the market’s prospects, at least on an intermediate-term basis which is our focus. However, we are always open to evidence pointing to the contrary. The recent bounce in stocks may contain such evidence.“ That evidence referred to the Nasdaq market. However, we have also found a similar story when looking at the SPDR S&P 500 ETF, SPY.
Since the low last Wednesday, the SPY has managed to rally at least 1% on 3 of the 6 days. Each of those 3 big up days came on below-average 10-day volume. Since 1994, there have been 36 other occassions in which the SPY managed to rally at least 1% during 3 of 6 days on below average volume.
Historically, these such clusters have led to poor performance, at least in the short-term. Here are the median SPY returns following those occasions.
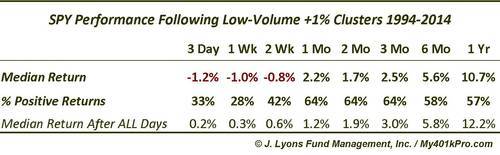
The ETF did poorly, though, not disastrously, from 3 days out to 2 weeks. Only 10 of the 36 instances saw higher returns one week out so the short-term weakness was pretty consistent. After that, the SPY rebounded and by the end of one month actually saw higher than typical median returns. This fits with the scenario suggested by other analyses that point to a "retest” or at least a pullback of some type before the market is again off to the races, i.e., a post-bounce lull, perhaps testing the previous low before a sustainable rebound. Of course, that flies in the face of the ubiquitous V-bottom of the past few years, so it would be a change of character for this market.
In reference to market bottoms, to identify occasions most similar to our current circumstances, we also looked at just those occurring soon (i.e., a month) after at least a 3-month low in the SPY. Here are the returns following the 25 such instances meeting that criteria.
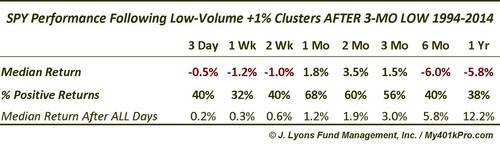
The results out to 3 months are similar among just these occurrences. The SPY tended to show weakness for a couple weeks before rebounding strongly. The difference came after 3 months. And it was a stark difference. While the median return following all clusters of low-volume 1% up days eventually led to longer-term performance in line with the norm, those following lows did not. In fact, out to 6 months and 1 year, the median return was substantially negative. While it is difficult to place too much weight on this event with relatively few precedents, it may be a concern after whatever intermediate-term rally transpires runs its course.
While we don’t focus much on volume, the recent trend of low-volume +1% up days in the SPY is concerning. These events have consistently led to short-term weakness in the past. Furthermore, if history is to be a guide concerning these occurring after the SPY made a 3-month low, it may also be a longer-term worry as well.
________
More from Dana Lyons, JLFMI and My401kPro.


