S&P 500 streak above its 200-day moving average is over – what now?
All good things must come to an end. That includes the S&P 500’s streak of closing above its 200-day simple moving average which ended yesterday after 477 days. While it wasn’t the Joe DiMaggio of all-time streaks, it was the 3rd longest in history – call it the Pete Rose of streaks. Only those ending in May 1956 (628 days) and August 1998 (525 days) went longer.
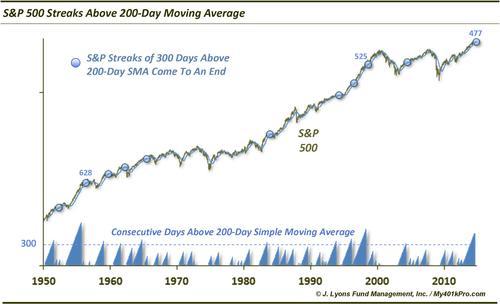
So besides a good bit of trivia, what is the significance of a long streak like this coming to an end? We took a look at other similar streaks in history to see what the aftermath was. Considering there have been only 2 streaks this long in history, we widened the net a bit to look at all streaks longer than 300 days. Since 1950, there have been 10 such streaks in the S&P 500 before the most recent one. These are the results following the culmination of the streaks.
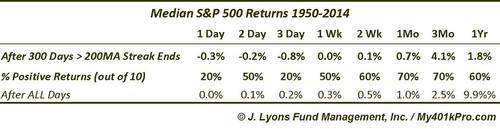
While the sample size is small and does not lend itself to statistically significant conclusions, superficially the takeaways are pretty clear. The S&P 500 has consistently seen further selling in the few days following the end of the streak with just 2 of the previous 10 occurrences seeing a positive return 3 days later.
In the intermediate-term, the index tended to bounce. The sweet spot was out 3 months when 7 of the 10 saw positive returns with a median returns of 4.1%, well above the median after all days of 2.5%. Yet, that outperformance did not last as the median return a year later was just 1.8%, with 4 of the 10 showing losses a year out. Therefore, 4 of the 10 occasions that ended such long streaks essentially marked a significant market top, or initial top.
We will mention that 3 of the 4 instances showing 1-year losses occurred in the 1950’s and 1960’s. The significance of that fact isn’t merely that it was a long time ago. The more important point is that using the 200-day moving average was a much more effective tool back then. In recent years (or decades), use of the moving average has been less reliable. So it is with all forms of analysis once they become popular among the masses.
In summary, if the limited historical precedents marking the end of long S&P 500 streaks above its 200-day moving average are any guide, we can expect to see some further weakness over the next few days. By a few months out, however, stocks “should” be higher, though the sustainability of such a rally may be questionable.
________
More from Dana Lyons, JLFMI and My401kPro.


