The V-Bottom is STILL in fashion

The V is baa-aack. No, not the dreadful yet alluring mid-80’s sci-fi, quasi-cult classic mini series wherein aliens arrive on Earth in a mother ship and dwell seemingly peacefully among humans while plotting to take over the planet. No, it’s something more frightening, at least to perma-bears and those attempting to navigate present-day markets according to traditional methodologies. It’s the V-bottom. And not only is the V-bottom still in fashion, but we are witnessing the mother ship of all recent V-bottoms.
As a refresher, when alluding to V-bottoms, we are referring to the stock market’s tendency to undergo a steep sell off, only to immediately bottom and swiftly rally back to its previous highs. We distinguish these V-bottoms from more traditional bottoms in which the market retests the initial low or at least chops about temporarily before beginning its eventual ascent. Specifically, for sake of objective identification, we are using the following criteria to define V-bottoms:
-
a 52-week high
-
a subsequent greater than 3% sell off to at least a 1-month low
-
a subsequent rally to within 1% of the previous high with at least 7 of 10 days being up and no down days worse than -1%
We have mentioned V-bottoms several times this year…because they keep happening! As the following chart indicates, the V-bottom has been a much more frequent occurrence over the past 2 years than it has historically.
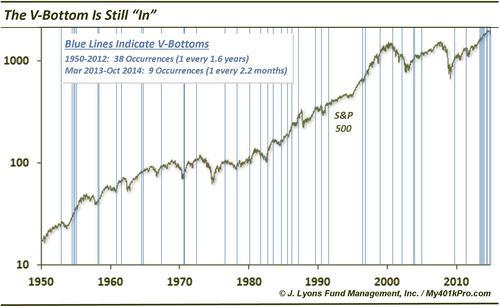
From 1950 through 2012, the S&P 500 experienced 38 such V-bottoms, or 1 every 1.6 years. Since March 2013, there have been no less than 9 V-bottoms. That is 1 every 2.2 months! In fact, the last time we mentioned V-bottoms was on September 19, which happened to be the peak of the last post-V-bottom cycle. And here we are less than a month and a half removed staring at yet another one.
So now that we have identified yet another occurrence, what can we expect? Using the prior instances of the past 2 years as a guide, we can expect the following:
-
minimal drawdown (i.e., 1%) from the point the S&P 500 first recovers to within 1% of the previous high (now)
-
another month of gains: the average rally lasted 35.5 days after the low (today would be day 11)
-
the S&P 500 at 2080: the average rally has taken the index 3.5% above the previous high (2010)
Here are the paths of each of the V-bottoms since March 2013.
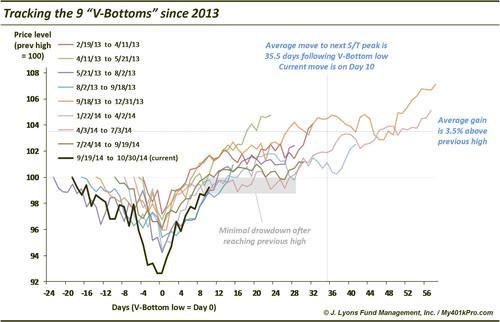
The current V-bottom fell further and now has recovered more ground than any of the prior occurrences. Of course, there is no guarantee that this V-bottom will follow the path set out by either the average of the previous V-bottoms or any of them individually. However, given that the V-bottom remains a common trait of the current market, fighting that path set forth over the past few years will continue to be a losing battle. Just as the skepticism toward the possibility of a V-bottom has continued to be.
________
More from Dana Lyons, JLFMI and My401kPro.


