Updating The Most Significant Chart Event Of This Era
Back on July 2, we posted a Chart Of The Day which we ridiculously titled “The Most Significant Chart Event Of This Era?”. The subject of the chart was an index called the Value Line Geometric Composite. While it’s a mouthful, the index is one of the broadest measures of the U.S. stock market, as we described in the post:
So what is it? It is an unweighted average made up of approximately 1600-1800 stocks. The “Geometric” portion of its name comes from the fact that the daily index change is calculated by essentially using the median change of all its constituents. Therefore, it is thought to best represent what the median, or typical, stock in the broad market is doing.
At the time, the major development on the Value Line’s chart, and the impetus behind the hyperbolic title, was its proximity to other historical tops. Specifically, it was hitting the level where it had topped in 1998 and 2007. As we stated in the post:
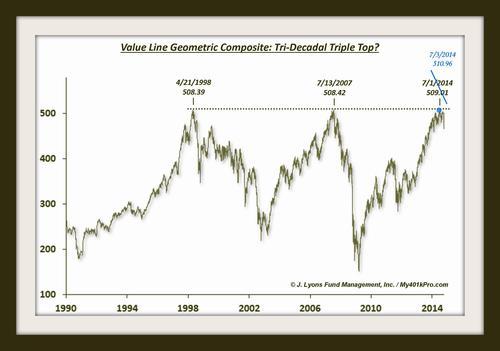
If we told you that a major broad U.S. equity index was in formation to potentially form a triple top spanning three decades, would you believe it? Well, it is an actuality…
Indeed, after topping at 508.39 in 1998 and 508.42 in 2007, the Value Line Geometric Composite closed on July 1 at a level of 509.01. We wondered if it was conceivable that the index could form a triple top covering a span of 3 decades, a possibility that we conceded faced long odds:
Realistically, what are the odds that the Value Line Geometric Composite forms a triple top here? Considering the current momentum in the market and the fact that prices have continued to steamroll any and every concern of historical significance, the odds don’t seem very good. In fact the index could bust out 2% above this level today and render the title of the chart extremely ridiculous (which it probably is already).
Well, in fact the Value Line did not top at 509.01 on July 1. It topped at 510.96 on July 3! And it has been dropping ever since. Here is the updated chart:
After closing at 465.91 yesterday, the index is down close to 9% from the July 3 high. However, this post is not about back-slapping. There are presently significant implications to the recent weakness: namely, a broken head-and-shoulders formation.
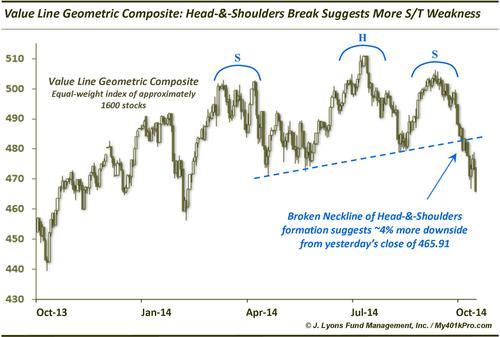
Yes, the head-&-shoulders formation is one of the more overused and incorrectly identified chart patterns. It is also one that is being thrown around a lot these days. However, sometimes it is still valid. It is also fairly accurate in targeting further weakness once the neckline breaks. The reason is simple: a broken head-&-shoulders pattern is simply a manifestation of a downtrend. The right shoulder of the pattern indicates a lower high and the neckline break indicates a lower low. It therefore should not be surprising that it typically leads to further weakness.
It also should not be surprising that so many of these h-&-s patterns are being identified now given the fact that so many stocks and indexes are exhibiting topping characteristics and/or making lower highs and lows. This particular h-&-s iteration involves an upward sloping neckline. The Value Line actually broke the neckline last week and has followed through with further weakness. Based on a measure of the formation, a rough target would be around 450, implying almost 4% more downside in the index in the near-term.
When we posted the chart on July 2, we acknowledged its far-fetched, hyperbolic nature. For one, with stocks still screaming higher the odds were long that even a short-term top would be formed in the vicinity of the Value Line at the time. Secondly, the odds were astronomical against a long-term triple top spanning 3 decades being formed. Lastly, even if a long-term top was formed, the notion of it being the era’s “most significant chart event” might still be absurd – or at least debatable, given the many other candidates. However, as we wrote in that post:
The top in the Value Line Geometric Composite in 1998 occurred at 508.39. The top in 2007 was 508.42. It is possible that this was just random. However, let’s also consider the possibility that it wasn’t random considering the tops occurred within 0.006% of each other 2,316 days apart.
However, on the 0.006% chance that a triple top spanning 3 decades does form here and now, we had to post this chart today.
Well, given that the first outcome – a short-term top – indeed transpired against long odds, perhaps the odds have increased that the other, long-term outcomes will also come to pass. If only up to 0.6%.
________
More from Dana Lyons, JLFMI and My401kPro.


