String of Low Volume New Highs A Short-Term Concern
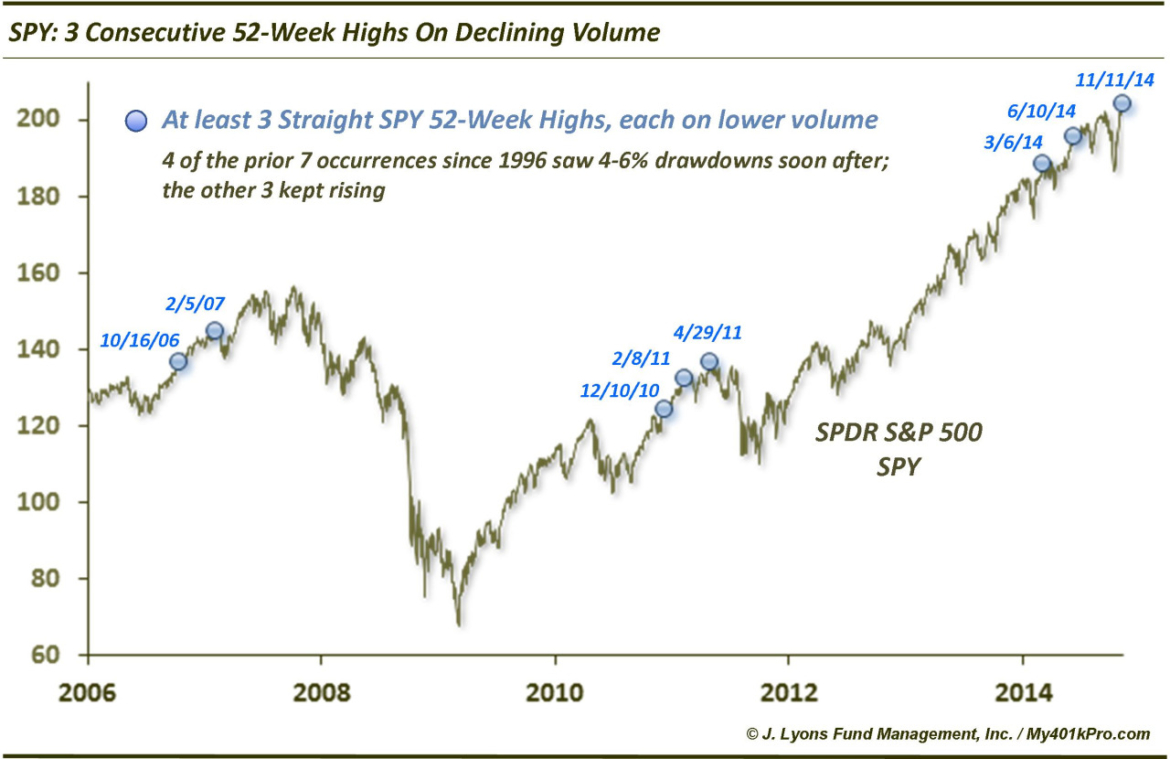
A couple weeks ago, we commented that the waning volume accompanying the rally off the October low had historically led to weakness, albeit in the short-term. Well, the ascending right side of the V-Bottom basically chewed up those historical tendencies and spit them out on its way to a new high. At the risk of introducing another ill-fated concern regarding low volume, we present today’s Chart Of The Day. Each of the past 3 days, the SPDR S&P 500 ETF (SPY) has closed at a 52-week high. It also did so on declining volume on each of those days.
Looking at the history of the ETF, it has gone on such streaks on 10 other occasions, including 3 times in 1995 and 1996. After that, it wasn’t until 2006 that it did so again. Here are the dates of the 7 streaks since 2006 and the aftereffects.
- 10/16/2006 SPY continued higher unabated for 4 months.
- 2/5/2007 SPY crept slightly higher for 2 weeks before dropping 6% in the following 2 weeks. 5 weeks afterward, it would be at a new high again.
- 12/10/2010 SPY continued higher unabated for 2 months.
- 2/8/2011 SPY crept higher for 10 days before dropping 5% in the following 3 weeks. 5 weeks afterward, it would be at a new high again.
- 4/29/2011 SPY topped that day and dropped more than 6% in the following 6 weeks. After a short bounce to near its high, the ETF plummeted almost 20% in a month..
- 3/6/2014 SPY topped the next day before dropping 4% over the next 4 weeks. A month later, it would be at a new high again.
- 6/10/2014 SPY continued higher unabated for 6 weeks.
So the pattern has worked like this: either the SPY keeps heading higher unabated for up to several months, or we see it form a short-term top fairly quickly. A drop on the order of 4%-6% has been the norm following those tops. However, the SPY was at a new high about a month later following each of those short-term pullbacks (minus the summer 2011 failure).
We don’t want to ring the alarm bells too much based on this phenomenon, particularly with the few occurrences and the disparate outcomes. Furthermore, this market has continued to steamroll these kinds of concerns. On top of that, even when the pattern has run into short-term weakness, it has bounced to new highs again in fairly short order. All that said, perhaps now is not the ideal risk:reward setup for traders on the long side.
____
Read more from Dana Lyons, JLFMI and My401kPro.


