Another S&P 500 New High, Another Odd Divergence

Since the S&P 500 hit a new 52-week high a couple weeks ago, the divergence theme has emerged yet again. We might as well get used to it also – at least until a significant reset (i.e., correction) or explosive broad market breakout occurs.
Last week, we mentioned the rare example whereby the NYSE Composite was still 2% away from making a 52-week high of its own. Today, we see another rare – and odd – divergence. The S&P 500 is at a 52-week high, yet neither the S&P 500 Pure Growth nor Pure Value Indices are at a 52-week high. In fact neither index has been able to trade above its September high.
What are the “Pure Growth and Pure Value Indices”? They contain only those constituents of the S&P 500 that represent “growth” or “value” characteristics in the strictest sense. Unlike the regular S&P 500 Growth and Value Indices which together contain all of the S&P 500 stocks (with some stocks actually residing in each index), the Pure Growth and Pure Value Indices do not necessarily include all of the S&P 500 components. Therefore, they are true “growth” or “value” indices.
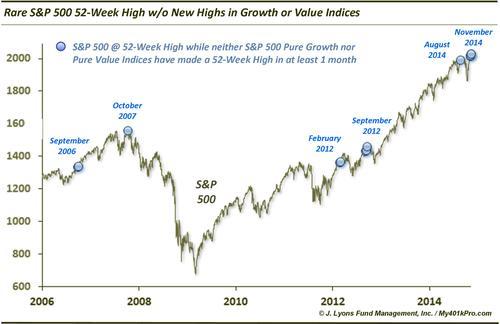
Typically, either the growth or value area is leading the market. Thus, with the S&P 500 at a new high, we can expect at least one of the two “style” indices to also be at a new high. However, on a rare occasion, neither can quite keep up with the main index. How rare is this divergence? Since the “Pure” indices were first introduced in 2005, there have been 5 other unique times that satisfied the following conditions:
- a 52-week high in the S&P 500
- no 52-week high in at least 1 month in either the S&P 500 Pure Growth or Pure Value Indices
The first instance, in September 2006, was simply a result of the S&P 500 being able to rise above its spring high before the rest of the market caught up in short order. There was essentially no drawdown going forward. The next occurrence, in October 2007, was the polar opposite. It was a product of a market running out of leaders at the end of a cyclical bull market. Afterward, there was essentially no upside – only drawdown. The next 2 examples, in February and September 2012, saw temporary gains before 5-6% drawdowns over the subsequent 3 months.
The last example was in August. The Growth and Value Indices eventually made slight new highs in early September before rolling over into October with the rest of the market. With the S&P 500 at a new high now again, to the tune of about 1% above its September high, the Pure Growth and Pure Value indices are each 1% or more below their respective highs.
What is the takeaway? We suppose it would be nice if one or the other, i.e., Growth or Value, was accompanying the S&P 500 at a new high as it may demonstrate more evidence of strong demand for “something”. Instead, apparently the “tweener” stocks are leading the market at this time.
If it weren’t for the many other divergences present in the market, we probably would give much consideration to this development. However, with so many other segments of the market now failing to keep up with the major averages, it is a bit concerning – if not now, at least in the intermediate to longer-term.
________
“Robert Wadlow” photo by sundaypony.
More from Dana Lyons, JLFMI and My401kPro.


