Bullish Fund Assets Double Bears For 1st Time Since 2001

We’ve talked about various measures of investor sentiment quite often recently. To reiterate, these indicators measure either what investors say they are doing or what they are actually doing. In general, these metrics will trend along with prices until they reach an extreme in one direction or the other. At that point, they are often considered contrary signals as they become overloaded to that side and prices tend to shift back the other direction. More and more, these measures are beginning to pile up into the “extreme bullish” camp, as we recently pointed out with the Investors Intelligence and AAII surveys.
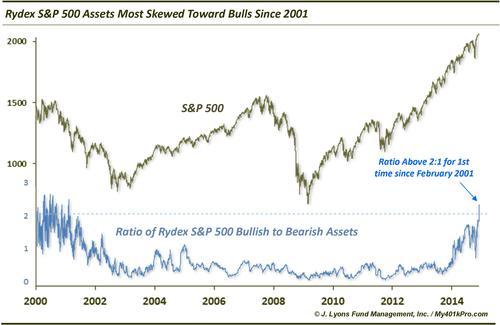
As we mentioned in a recent post on bullish ISEE options activity, we especially like to look at the real dollar sentiment gauges, i.e., what investors are actually doing. You can now add another indicator to the bullish extreme camp as the amount of assets in the Rydex S&P 500 bullish fund is now double the amount in the bearish fund for the first time since February 2001.
The Rydex family of mutual funds (now owned by Guggenheim) was founded in the mid-1990’s to provide funds for active trading. Since then, Rydex Funds have been used as a sentiment source by measuring the amount of assets in their bullish (long-oriented) funds versus bearish (inverse-oriented) funds. And the most popular measure has involved using the assets in their oldest S&P 500 long fund, the Nova Fund, and the oldest inverse S&P 500 fund, the Ursa Fund.
During the years surrounding the 2000 market top, the ratio regularly hit 2:1, i.e., twice as many assets in the bullish Nova fund as the bearish Ursa fund. The 2000-2002 bear market took a toll on investors’ psyches as the ratio failed to attain those heights again. During the mid-2000’s, the top of the normal range in the ratio was around 1:1. With the dawn in popularity of ETF’s in the late 2000’s, the level of assets in these mutual funds dropped significantly. There were generally more assets in the bearish Ursa fund (as hedges) than in the Nova fund. Indeed, in the latter half of the decade, the high end of the ratio was only around 0.5:1. That is, the “bullish extreme” tended to be when the Nova assets reached half those of the Ursa Fund.
In the beginning of this year, this began to change. In January, the ratio spiked above 1:1 for the first time since 2004. It eventually reached near 1.7:1 around the short-term tops in July and September. And in the past few days, the ratio has exploded above 2:1 for the first time since February 2001.
It is impossible to say for certain the reason behind this recent jump in Nova assets. In short though, it is difficult to explain this away as anything other than a jump in bullish sentiment. Particularly concerning is the possibility that investors are becoming increasingly more comfortable in holding mutual fund longs rather than ETF’s, at least relative to their preferences over the past several years. Furthermore, this is not simply a “relative” issue. The absolute amount of assets in the Nova Fund has jumped in the past few days to the highest level since February 2007.
The trend remains higher in most areas of the U.S. equity market. However, the evidence of extreme bullish sentiment is increasing by the day with this measure of Rydex Bull:Bear assets being the latest example. This growing bullish sentiment is just adding potential risk for whenever the catalyst is triggered putting an end to the bull run.
____
“Bull” photo by Thomas Hawk.
Read more from Dana Lyons, JLFMI and My401kPro.


