Is The Rampant Bullish Sentiment Really A Bad Thing?

Given the combination of now wide-open lines of investor communication and a proliferation of new investor engagement metrics, the topic of market sentiment has really come to the fore in recent years. With everyone seeking an edge in the markets, investors and institutions have put forth concerted efforts toward attempting to measuring investor bullishness and bearishness – and toward quantifying when such metrics reach sentiment extremes. Due to current sentiment readings (i.e., extremes in bullishness), we thought we’d tackle the topic, at least on a cursory level.
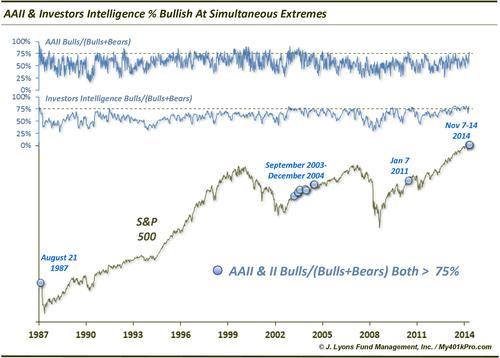
To do so, we looked at the granddaddy and daddy of all investor sentiment surveys, Investors Intelligence and the American Association of Individual Investors. The reason we chose those two is simply because they have more historical data than just about any other sentiment surveys. And, as our Chart Of The Day shows, current reading on both surveys are showing an extreme amount of bullishness.

This is one of the very few times in history that both the AAII and II surveys were each showing at least 75% bullishness, as measured by bulls / (bulls+bears). We measure it this way in order to identify true extremes among those offering an opinion, i.e., it weeds out the wishy-washy “neutral” and “correction” categories. Since the inception of the AAII in 1987, the current readings (actually the past 2 weeks) represent just the 4th time ever in which the bullish % in both surveys was at least 75%. (We will add that there are unlimited ways to parse this data and this study is by no means intended to be exhaustive).
So has this been a negative for the market in that the bullishness went too far? The short answer is yes, sort of. Here are the previous readings and results.
- 8/21/1987 Marked the exact top in the market before the October crash. The S&P 500 dropped about 36% in 2 months.
- 9/2003 to 12/2004 OK, this wasn’t a unique occurrence but a total of 8 that could probably be lumped into 1 cluster. Although the S&P 500 gained roughly 16% over the period, the gains came mostly at the end of each year, 2003 and 2004. The bulk of 2004 was flat. 4 of the 8 extreme bullish readings came in December of 2003 and December 2004, following the rallies.
- 1/11/2011 The S&P 500 managed to gain as much as 8% through April. It then went into a prolonged topping pattern followed by the near-20% drop in August-October.
So, out of 3 occurrences, one was a disaster, one headed higher for a few more months before a mini-disaster and the last one was ho-hum. So you can see why we say it is a negative, sort of.
Here are the specific returns in the S&P 500 following the individual 12 events (incidentally, the 12 weeks represent less than 1% of all months in the survey period since 1987.)

Overall, the returns are clearly worse than normal. However, they are not disastrous.
It is likely that, considering the AAII sentiment survey began in July 1987 and the extreme bullish reading preceded a crash shortly afterward, investors or analysts perhaps placed too high of an expectation on its (and the II’s) ability to accurately forecast serious market trouble. One event was not enough to make a trend. In addition, with the widespread awareness that these surveys are thought of as contrarian in nature, i.e., the “dumb money” at extremes, we suspect that it influences respondents’ answers. That is, nobody wants to be included in the dumb money category at an extreme.
Despite that, as the results above suggest, these surveys do still hold some value in gauging when sentiment goes too far. That is the power of the market. It can eventually force even those self-aware enough not to want to appear as dumb money to eventually capitulate so as not to appear to be missing out. That is when sentiment has gone too far. That appears to be the case presently. Yet, while historical returns are subdued following these conditions, it does not guarantee either an immediate decline, nor a significant one.
____
Read more from Dana Lyons, JLFMI and My401kPro.


