Stock Option Bulls Go Streaking
One method of analyzing stock market sentiment is by measuring activity in the options market. The benefit of this type of analysis is that, contrary to gauging sentiment based on what respondents say (i.e., surveys), this measures what traders are actually doing with their money. When it comes to true sentiment, actions certainly do speak louder than words. And on a short-term basis, options traders’ actions are telling us that they are feeling pretty bullish.
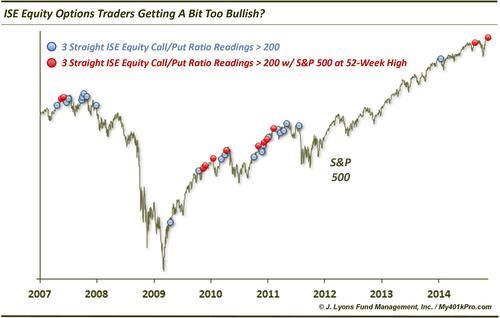
Specifically, looking at the International Securities Exchange Equity Call/Put Ratio (ISEE), we notice elevated bullish readings above 200 for 3 consecutive days now.
As we have mentioned before, the ISE reports their options ratios a little differently than most exchanges. First, their data is reported as Call/Put ratios rather than the customary Put/Call manner. That means that high readings indicate bullish sentiment. Secondly, the ISE only includes opening long positions in their options ratios. Lastly, the exchange includes only customer trades, not market maker or firm trades. The ISE argues that constructing the data in this manner is "thought to best represent market sentiment".
The ISEE data began in 2006 so it is relatively new. However, it has become less erratic in recent years as it has matured and thus, appears to be more reliable as a sentiment indicator than perhaps in its early years. As an example, while it wasn’t unusual for the ISEE to remain above 200 for 6 or 7 straight days a few years ago, readings that high have become more rare. That perhaps is an indication that the elevated sentiment reading is more meaningful now.
The ISEE has been above 200 for 3 straight days on just 2 other occasions in the past 3 years. Those dates were August 21, 2014 and January 16, 2014. Following the August occurrence, the S&P 500 only saw 1% of upside before the sell off into the October lows. The January occurrence marked the short-term top and preceded an immediate 5.5% decline.
Looking since 2006, we found 37 such occurrences (not including days when streaks continued beyond 3). While the S&P 500 continued higher on occasion (particularly in late-2010), in general, returns were subpar across all time frames following these streaks. Here are the median returns following the streaks, including returns following such occassions when the S&P 500 was at a 52-week high, as it is now.
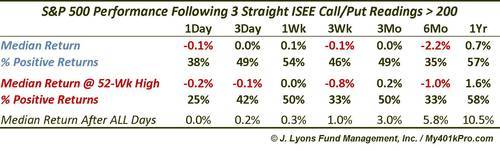
On average, S&P 500 returns were weaker than normal even out to 1 year. Considering the signal is tracked only over a few days, however, we would tend to only consider the shorter-term forward returns as relevant to the signal. That is, the 3-day elevated Call/Put ratio is likely only an indicator that short-term conditions have become too bullish.
That is not to say that the readings are irrelevant to the longer-term, however. The poor returns from 6 months to a year following high ISEE readings are a result of several occurrences in 2007 and 2011. These readings obviously preceded a cyclical top in 2007 and a near bear market in 2011. Perhaps the incidence of those readings at the time were an indication of a late-stage bull market environment. Evidence backing up that possibility is the dearth of any such readings since 2011 until this year.
Therefore, we cannot dismiss the possibility that this behavior from the options market is not just a short-term sentiment extreme but symptomatic of a mature bull market environment.
____
Read more from Dana Lyons, JLFMI and My401kPro.


