
Stock Options Traders Head For The Hills
We’ve talked about the International Securities Exchange Equity (ISEE) Call/Put Ratio several times during the past year. Due to its unique construction, it has become a favorite of ours for highlighting inflection points in investor sentiment. The ISEE excludes firm trades that are quite likely to be hedges and also excludes volume on closing positions when calculating the Call/Put ratio. Therefore, the resulting ratio may be a more pure indication of investor sentiment than some of the other options ratios. And if this is indeed the case, we may be near an extreme in “fear”, at least for the short-term.
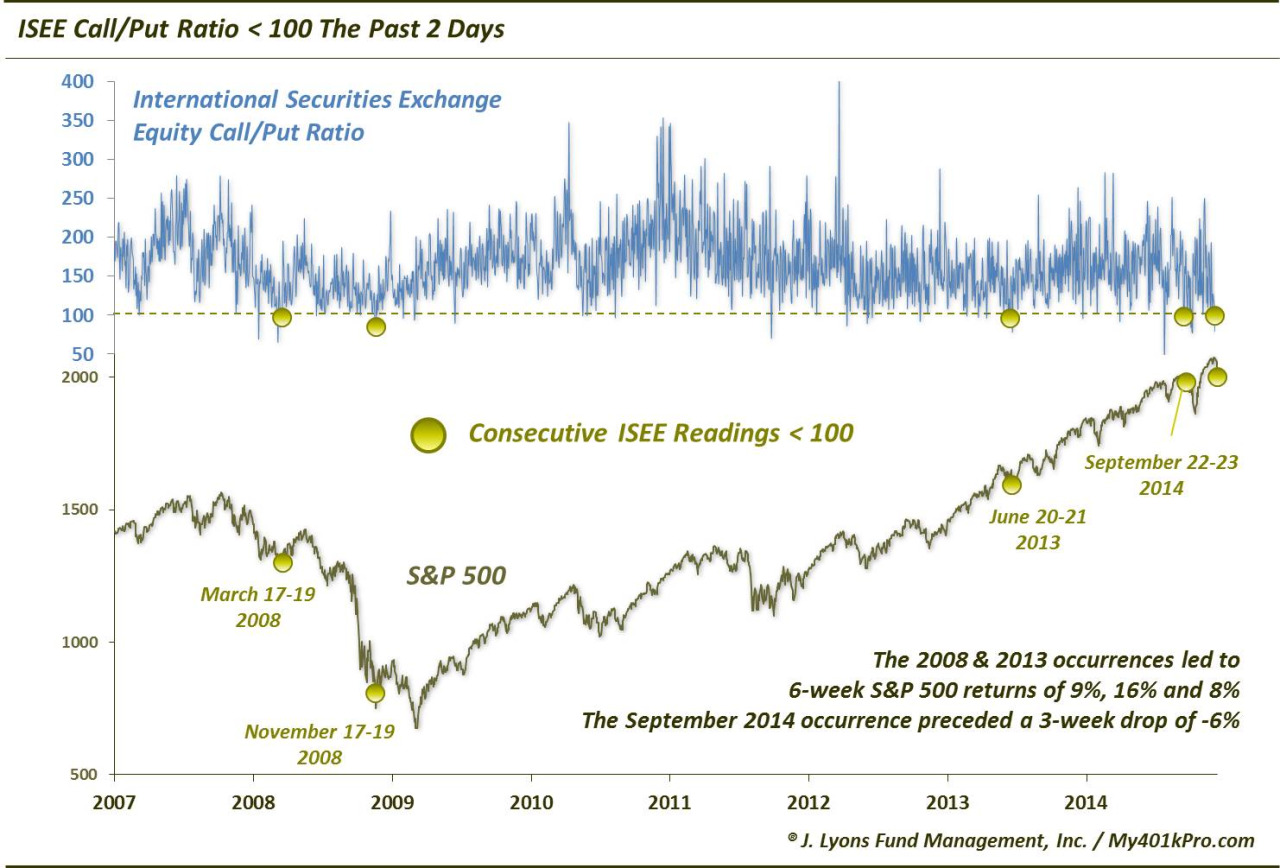
Why do we say this? The 100 level in the ISEE has historically often been a signal that options traders are becoming fearful (100 means equal call and put volume). Dips below that level have on several occasions come near at least short-term lows in the market as traders have either stormed into puts and/or have shied away from buying call options. The ratio has been below that 100 level for each of the past 2 days. This is a phenomenon we’ve only seen on 4 other occasions in the data’s history since 2006.
The first three instances almost exactly marked short to intermediate-term lows:
March 17-19 2008 The S&P 500 formed an intermediate-term low on March 17. It rallied as much as 10% over the next 6 weeks and didn’t close lower for 3 months.
November 17-19 2008 The S&P 500 dropped over 6% the following day, forming an intermediate-term low. Over the next 6 weeks, it gained as much as 16% above the 19th close and never closed lower over the following 3 months.
June 20-21 2013 The S&P 500 dropped over 1% the following day, forming an intermediate-term low. Over the following 6 weeks, it gained as much as 8% above the 21st close and has not closed lower since.
Clearly 3 of the 4 precedents led to very little drawdown, especially in terms of time, and healthy bounces subsequently. With today’s intraday weakness, we may be witnessing a repeat of the November 2008 and June 2013 episodes in which the market dropped for 1 more day before rallying. Bulls would obviously like to see the market follow this template.
Then there is the catch: the 4th and most recent occurrence on September 22-23 of this year. We covered that occurrence in a September 24 post, noting that “taken at face value this development is a positive one.” However, one of our hesitations regarding the possible bullish signal was that the market was “only 3 days removed from the all-time high.” It seemed odd that there would be a legitimate extreme already formed in the level of fear among options traders. Indeed that concern was warranted and trumped its “face value” bullish signal. The S&P 500 went on to lose another 6% over the next 3 weeks.
So which of the instances is the present circumstance more likely to follow? It’s hard to say for sure, but circumstances, on balance, more closely resemble the June 2013 and September instances than the others. The first 3 instances were all at least 1 month removed from the most recent high as opposed to just 3 days in the September example. Friday was only 5 days removed from the high close.
In drawdown terms, the 2008 episodes each saw much deeper losses from the market’s recent high than we are seeing now. However, the June 2013 instance saw the S&P 500 down about 4.7% from its high. That’s not too far off of Friday’s standing -3.5% drawdown. And using today’s low, the S&P 500 would be right in line with that -4.7% drawdown.
Obviously the market need not bear any resemblance to the prior episodes. But the point is that the sell off in percentage terms is at least proportionate with the June 2013 occurrence and, thus, it is not inconceivable that it could produce an extreme in fear on some level. On the other hand, the September instance occurred with the S&P 500 down less than 1 full percentage point from its high.
It will be interesting to see the reading at the end of today. Should we get a 3rd straight ISEE reading under 100, it would join just the 2 occurrences in 2008 in that regard. That may just tip the odds into the “bullish” camp in the short-term.
Even without a 3rd straight reading, history suggests that we should be close (w/in a day?) to at least a short-term bounce in the S&P 500. Options traders have rarely become this “fearful” on consecutive days. On 3 of the 4 prior occassions, the market bounced strongly over the subsequent 6 weeks. That would coincide with some of the stats we’ve looked at recently calling for a “Santa Claus rally”. If Santa fails to show, despite this preponderance of evidence, perhaps we should all be running for the hills.
____
Photo by Keith Alexander.
More from Dana Lyons, JLFMI and My401kPro.


