Just Your Average V-Bottom
For the past year or so, we have been discussing the stock market’s recent tendency to form V-bottoms after declines. By that, we mean that stocks have more or less immediately returned to the previous highs as quickly as they sold off. This is in contrast to the more traditional complex bottoming process involving a bounce and retest. As defined by the parameters we’ve outlined, we identified 8 V-bottoms just since the beginning of 2013. That is 1 every 2-3 months. For perspective, we identified just 38 such V-bottoms in the prior 62 years, or 1 every 1.6 years.
At the depths of the October selloff in stocks, we surmised that while perhaps the worst of the selling was over, the market may be in for a more complex bottoming process considering the extent of the damage. However, in an October 31 post, due to the S&P 500’s swift recovery back to its previous high, we announced that “The V-Bottom is STILL in Fashion”.
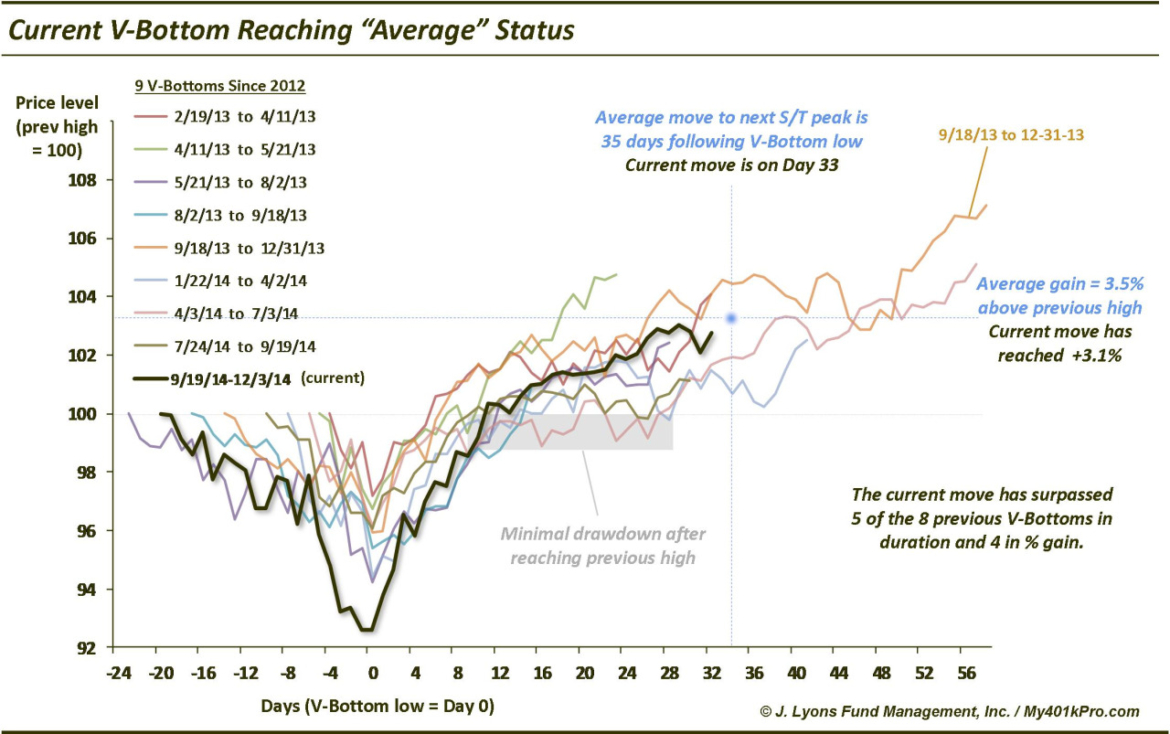
We also included a chart in that post that tracked each of the 8 previous V-bottoms of the past 2 years as a visual guide for what to expect in the current iteration. Today we updated the chart to see how the current V-bottom has proceeded versus the template. It may “feel” as though the current version has been stronger and more persistent than previous V-bottoms. Perhaps that is due to the fact that it rallied from greater depths than any of the previous examples. However, as it turns out, the current V-bottom is just about exactly average.
Why do we say this? First of all, the current move followed the script of experiencing very little drawdown (actually, none) upon reaching its previous highs. Secondly, the average V-bottom has lasted about 35 days beyond the selloff low. Today is day 33 for the current move. Lastly, the average gain following the previous V-bottoms has been about 3.5%. This move has gained as much as 3.1%. So it has been a pretty average V-bottom across the board.
So how much longer and farther will it go? There is obviously no way to know for sure. For all we know, it could end today. However, simply for reference, 3 V-bottom cycles traveled beyond 33 days. One lasted 41 days, which would take us to the middle of December. The other 2 lasted 57 and 58 days. That would take us roughly through the seasonally strong first week of the new year.
In terms of the magnitude of gains, the 4 V-bottom cycles that went further than this one has thus far gained between 4.1% and 7.1%. That is exactly 1-4% more than the current move. Hypothetical gains of that magnitude would put the S&P 500 at 2094-2154.
One other possible consideration is that the V-bottom cycle that lasted the longest and traveled the furthest was the one that took place at the end of last year. After carving out a low on October 8, the S&P 500 rallied 58 days and 7.1% above the prior high before topping on December 31. While it seems to be the consensus view, if traditional positive seasonality, combined with performance pressure on the part of underperforming managers exerts influence on this market, such an end of the year repeat is feasible.
We prefer to stay away from the kind of hypotheticals and what-if’s contained in this post and instead focus on what “is”. However, part of the conjecture is a simple recognition of the existing market environment. The more accurately you can define the type of environment you are in, the more successful you will be with your decision-making. And until further notice, we are still within the confines of a V-bottom cycle, and an average one at that.


