An Unprecedented Rally – Part 1

European Space Agency image of Comet 67P as seen from the Rosetta spacecraft which recently made an unprecedented landing on the surface of the comet.
2014 has been a year of odd events in the stock market and yesterday’s rally ranks right up there with the oddest. By the end of the day, the numbers were pretty stunning, even for this unusual environment. In some ways, the rally was not only unusual, but also unprecedented. This makes things a bit tricky of course when attempting to analyze the day’s impact on the market’s future performance (it is difficult enough when we have plenty of precedents). In this case, it’ll be like the Rosetta spacecraft that executed an unprecedented comet landing. It was unclear exactly what would be discovered the events unfolded.
So what made yesterday so unusual? We have discussed on several occasions recently the concept of 90% Down Volume Days, in which 90% of the volume during the day occurred in declining issues. Yesterday, we saw a 90% UP Volume Day on the NYSE, with 90% of the volume going towards advancing stocks. This was the first 90% UP Day in over a year. Since 1970, we find 144 such 90% UP Days. Of those, only 51, including yesterday, occurred while the S&P 500 was already above its 200-day moving average, which is a basic way of delineating a bull market. So on average, we only see that type of a day once a year or so. But that’s only the beginning.
Of those 50 90% UP Days since 1970 when the S&P 500 was above its 200-day moving average:
-
yesterday was the FIRST that did not eclipse the previous day’s high.
-
yesterday was the FIRST that was also an “Inside Day” (i.e., within the previous day’s range).
-
yesterday was the FIRST that saw more NYSE New Lows than New Highs.
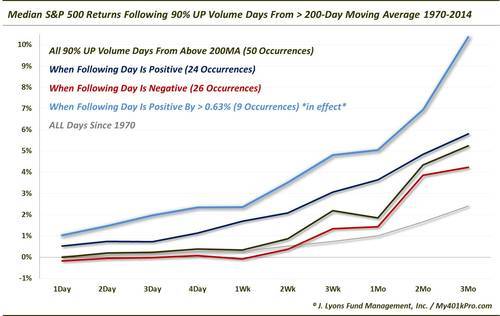
So you can see why we say yesterday’s action was so unusual. Since we don’t have historical precedents for the bulleted points above, we cannot determine, or at least speculate, as to their message regarding future returns. We can, however, examine the previous 50 historical instances of 90% UP Days from above the 200-day moving average. On average, returns following these events have been favorable. Median returns were better than average across all durations, especially in the intermediate-term of 1 to 6 months.

The better news, given today’s follow-through, is that when we’ve seen the market up the day after, returns going forward have been even more positive, at least in the short-term.

And even better news, given the MAGNITUDE of the follow-through today, is that returns going forward have been especially positive after strong up days following the 90% UP Day. Specifically, here is the performance when the 1st day is up more than 0.62%.

Here is a chart comparing the median returns listed in each of the tables.

Needless to say, results following strong follow-through to the 90% UP Days have been the most favorable for bulls. Whether or not the unprecedented circumstances we listed above will impact those results in any way, we don’t know. What we do know is that we will have more interesting data and charts tomorrow given today’s yet-again unusual action.
(Note: some of the figures were edited slightly after the initial post to adjust for rounding inaccuracy.)
________
More from Dana Lyons, JLFMI and My401kPro.


