An Unprecedented Rally – Part 2

European Space Agency image of Comet 67P as seen from the Rosetta spacecraft which recently made an unprecedented landing on the surface of the comet.
We mentioned yesterday that this year has been filled with unusual and often unprecedented events in the market. And while we may have a suspicion of what sort of connotations these individual events carry for the market’s prospects, given their unprecedented nature, like the recent Rosetta comet landing, the aftermath is unknown until events unfold. Speaking of comets, the latest iteration of odd market behavior is downright comet-like.
In Part 1 yesterday on this unprecedented rally, we looked at the rare phenomenon of 90% UP Volume Days occurring with the S&P 500 above its 200-day moving average, like we saw on Wednesday. We mentioned in the post that, based on historical precedents, the most bullish signal for the market’s future prospects would be a strong follow-through day to the upside. Uh, check.
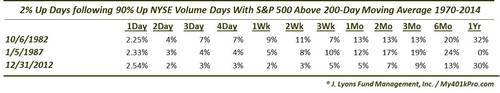
Of the 50 such prior 90% Up Days with the S&P 500 above its 200-day moving average, 3 saw follow-through moves of at least 2% the next day: 10/6/1982, 1/5/1987 and 12/31/2012. While we don’t want to put a lot of stock into a sample size of 3, the results following these days were awesome (if you’re a bull).
Speaking of 2% Up days, yesterday marked the 2nd consecutive 2% gain in the S&P 500. This is yet another rarity brought to you by this strange market.
How rare are consecutive 2% up days?
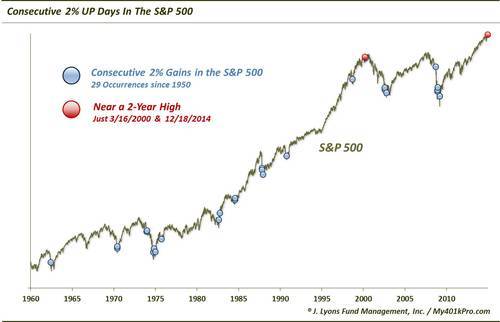
- Since 1950, there have been just 29 back-to-back +2% days in the S&P 500, or less than one every 2 years.
- This is the first such occurrence since March 2009.
What can we tell from prior occurrences, if anything? Many of them occurred in close proximity to a market correction or sell off, whether it was during a high-volatility bottoming process or while emerging from one. In terms of the market’s performance going forward, returns were, in general, subdued in the intermediate-term. This makes sense given that many of the occurrences took place within a choppy bottoming process. Furthermore, even in an uptrend, it is reasonable to expect the market to mark time temporarily in order to digest its gains after such an explosive move.
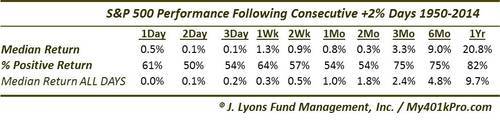
2 months out, the median return was flat, with just over half of the events positive. Longer term, things got better with 23 of the 28 prior instances showing a positive median return 1 year later of over 20%, more than double the historical average.
Here are the returns following consecutive 2% up days.
Again, given the limited number of precedents that we are dealing with over a 64-year period, we hesitate to hang our hat on these numbers. This is particularly so since there is a wide variance among the individual returns. Despite the lofty 1-year median gains, 5 of these events were followed by negative 1-year returns, the average of which was -23%. These instances included dates near the cyclical top in March and April 2000 as well as 2 separate events in December 1973, right in the teeth of a 2-year bear market. The variance can be seen in this chart of each event’s prospective returns.

So what are the odds that the current 2-day streak may lead to a “toppy” type of a result. Perhaps there are clues in the, once again, unusual circumstances present now. For example:
- Of the 29 consecutive +2% days in the S&P 500 since 1950 this was just the 2nd that began within 10% of its 2-year high. The other was on 3/16/2000, right near the cyclical top.
So there’s that. But there is also this:
- Of the 29 consecutive +2% days in the S&P 500 since 1950 this was just the 2nd that began above the 200-Day moving average. The other was on 10/7/1982, just after the secular bull market was launched.
Another indication that the current streak may be nearer to a top than some of the others (though, it does not preclude a shorter-term rally) is this:
- Of the 14 consecutive +2% days in the S&P 500 since the VIX began trading in 1986, this was the only one that began with the $VIX below 26, at 23.57. In fact, the median level of the VIX at the previous 13 occurrences was nearly 50. The lowest other figure was 26.43 on 3/16/2000.
So it appears that this iteration is a bit different than many of the other 2-day +2% streaks that we’ve seen.
Here are a few other perhaps merely trivial statistics related to this occurrence:
- Of the 29 consecutive +2% days in the S&P 500 since 1950 this one showed the 2nd weakest gain at +4.49%. Only 9/19/1975 was weaker at “only” +4.26%.
- Of the 14 consecutive +2% days in the S&P 500 since the VIX began trading in 1986, this one saw the 2nd largest percentage drop in the VIX, at -29%. Only 10/21/1987 saw a larger drop, at -51%.
So what is our takeaway from all this? Again, some of the market events this year have been like comet landings – unprecedented. We don’t know what to expect. We would like to take the longer-term positive returns at fave value. However, given the S&P 500’s proximity to the highs as well as the level of the VIX, we’ll have to take these stats with a grain of salt.
As we mentioned yesterday, the only thing we can be reasonably sure of is that, in this market environment, we’ll likely continue to see unusual and unprecedented events.
________
More from Dana Lyons, JLFMI and My401kPro.


