Freaky Friday: More Disturbing Behavior From The Stock Market

A few weeks ago, we dedicated a post to the unusual behavior in the stock market on November 13. Although the major indices closed the day higher, there was so much weakness under the surface that we dubbed it “One of the Ugliest ‘Up’ Days in History”. Friday, November 28 saw more unusual developments in the stock market. In this case, much of it was “ugly” again while some of it was just plain weird. To wit:
1) The number of NYSE New Highs and New Lows each hit a 1-month high on Friday. It is very rare for this to happen. Since 1970, we have found only 21 other such instances.
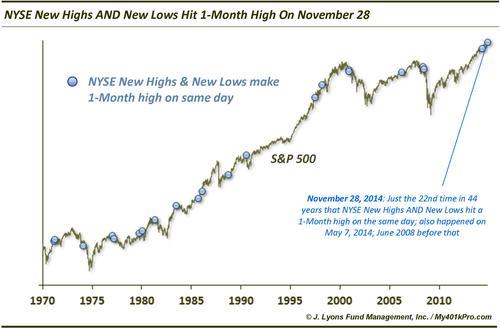
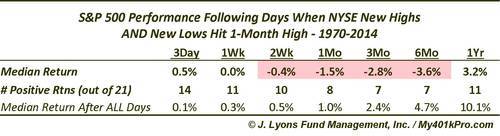
What is the possible reason for this phenomenon? One theory is that it is a sign of increasing uncertainty, suggesting negative connotations. This is the same general idea behind the Hindenburg Omen which issues a bearish warning when there exists a high number of both New Highs and New Lows. Whatever the theory, based on the historical precedents, it has been a negative for the market. Going forward, the majority of instances showed negative returns from 2 weeks to 6 months, with a median 6-month return of -3.6%.
2) The VIX was up 10% on Friday despite the Dow closing higher. While the Dow Jones Industrial Average closed up on the day (albeit by pennies), the S&P 500 Volatility Index (VIX) rose sharply, closing up over 10%. This is odd behavior as the VIX tends to move in the opposite direction as the market. This has occurred just 18 other times since 1986.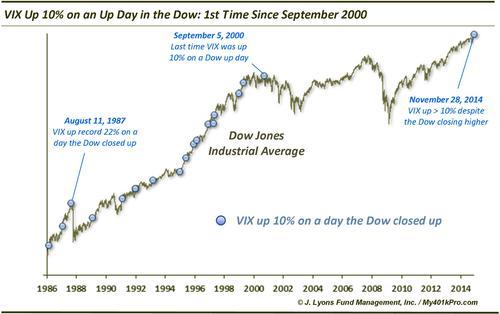
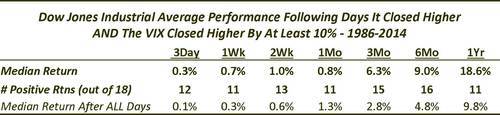
Based on a recent post dealing with strong VIX behavior at 52-week highs in the S&P 500, we would have expected this action to have a negative impact on market performance going forward. However, the the Dow has actually performed better than the norm afterward, although we are only dealing with a sample size of 18. There were a few inauspicious occurrences, however. These include the last instance, in which we have to go all the way back to September 2000, and an August 1987 occurrence preceding the October crash. At a minimum, we would prefer to see volatility staying low as opposed to rising.
3) The Russell 2000 had its 2nd worst day ever on Friday for a day when the Nasdaq 100 closed at a 52-week high. In the November 13 Ugly “Up” Day post, one of our reasons for the “ugly” moniker was the fact that despite the Nasdaq 100 closing at a 52-week high, the Russell 2000 was down nearly 1%, making it the 4th worst performance ever on such a day. Well, Friday topped that. The Russell actually closed down almost 1.5% despite the NDX new high.
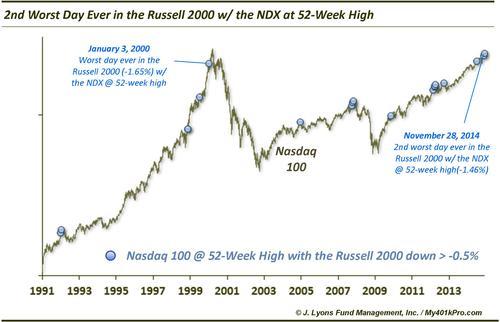
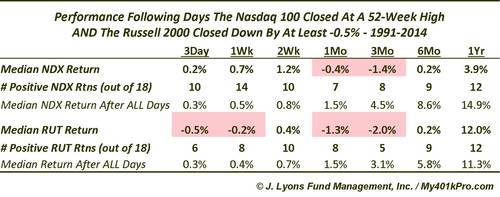
As we pointed out in the prior post, this has not been a good sign for the market going forward. It plays into the notion that healthier rallies are those that have the participation of as many segments of the market as possible. Here are the returns following these such days for both the Nasdaq 100 and the Russell 2000. Particularly weak have been the intermediate-term returns out 1 and 3 months.
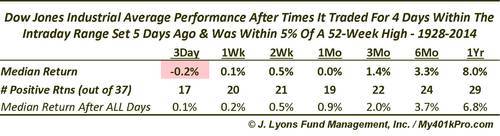
4) The Dow has traded inside of its intraday range of 5 days ago for the past 4 days. This development might just be put into the “weird” category as opposed to anything ominous, or promising for that matter. But since the big up day on November 21, the Dow has been unable to break out of the range established on that day. Since 1928, this has occurred on 58 prior occasions, with 37 of those occurring within 5% of a 52-week high.
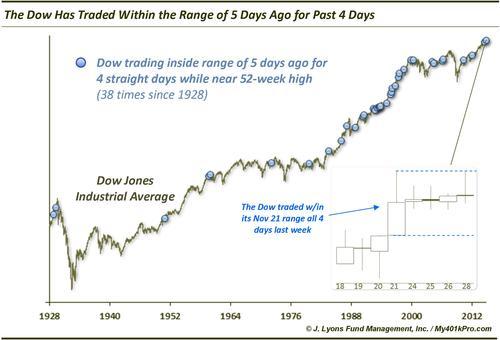
While it might be reasoned that such a pattern shows a concerning indecisiveness on the part of market participants, the returns after such events have more or less been in line with all days. So again, despite some dates at ominous times, like in 1929, 1987 and 2000, this is probably more of a trivial event than any sort of red flag.
We have written recently on multiple concerning developments that have our attention, from the short-term all the way out to the long-term. Several of these such developments are examples of atypical or unusual behavior in the market, suggestive of elevated risk. We saw a number of such odd developments on Friday, November 28. And while some of these can be chalked up to mere odd market trivialities, which always exist to some degree, the growing number of examples is of concern to us. Whether they are indicative of higher than normal uncertainty or volatility or lower than desired participation in the recent portion of the stock rally, we would prefer to see a lot less of this behavior.
Again, there will always be strange things going on in the markets; however, when it is relegated to a freak show, something’s not right.
____
Read more from Dana Lyons, JLFMI and My401kPro.


