Small Caps Finally Join Large Caps At New Highs

On September 4, we explored the fact that despite the S&P 500 trading at a 52-week high, it had been more than 100 days since the small cap Russell 2000 index had hit a new high of its own. As we mentioned in the post, “there are basically two ways this divergence can resolve itself. The Russell 2000 can catch up to the S&P 500 in new high ground or it can pull the S&P 500 down, causing a correction (or worse), refreshing the market before the cycle starts over again.” Well, as of Friday, we have resolution by way of the former as the Russell 2000 closed at its first 52-week high since March.
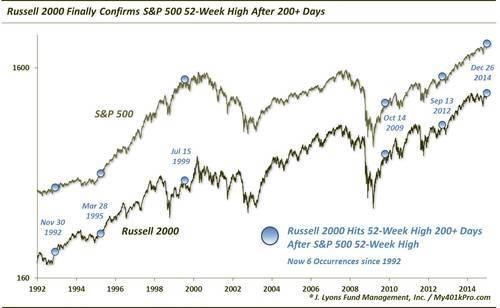
While the S&P 500 had been scoring consistent 52-week highs throughout the course of 2014, it took the Russell 2000 exactly 206 days to reach its first new high since March 4. At face value, this should be a welcomed development for the market’s future prospects. As we have often said, we are big believers that broad-based participation by stocks is an indication of a healthy rally condition. Therefore, a new high in the most popular small cap index certainly appears to be a positive for those in the bullish camp.
However (you knew that was coming), market action was not so positive following the previous few precedents containing these conditions, at least in the shorter-term. Since 1991, there have been 5 other times in which the Russell 2000 failed to match the S&P 500 at a 52-week high for at least 200 days. Here are the dates on which the small cap index finally achieved a new high and the number of days it diverged before hitting a new high:
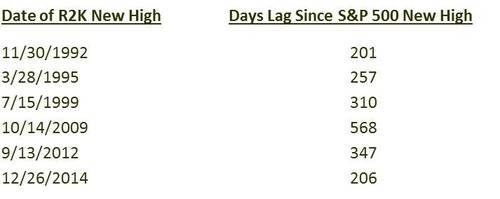
One could certainly argue that the 2009 incident was an outlier in that the market underwent a cyclical bear market since the time the Russell first failed to match the S&P 500 52-week high back in 2007. However, we left the date in as it technically meets the criteria.
As we mentioned, returns in the shorter-term were not too positive following these dates.
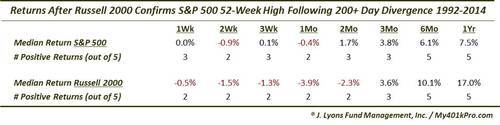
From 1 week to 2 months out, only 2 of the prior 5 incidents saw the Russell 2000 higher. The median 1-month return was about -4% and the median 2-month drawdown approached -10%. Returns for the S&P 500 were similar, though not as poor. The median S&P 500 1-month return was negative and the median 2-month drawdown was over -5%, double the normal drawdown. After that, things improve. By 6 months out, returns on the Russell 2000 and S&P 500 were positive all 5 times.
Theoretically, the Russell 2000 hitting a 52-week high and ending its long-running divergence with the S&P 500 is a positive for the market. The more the merrier we say, as it pertains to participation in this rally. Judging solely based on prior occurrences, however, that hasn’t exactly proven to be the case. However, that is merely in the shorter-term time frame of 1-2 months. Furthermore, with just 5 precedents here, we probably would not advise relying too heavily on that template. Net net, despite some shorter-term headwinds, we would certainly lean toward this being a positive development.
________
“Sundial” photo by xlibber.
More from Dana Lyons, JLFMI and My401kPro.


