Smart Money Options Traders Displaying Extreme Caution

A good portion of our research deals with the behavior of select groups of investors. The majority of the time, our objective is to identify extremes in investment posture by such groups – and fade them. That is, do the opposite of what the crowd is doing. This is what is meant by “contrarian” investing. Over the long-run, the crowd is invariably wrong at key turning points in the market, thus it pays to be a contrarian. (We will reiterate that we are only referring to extremes in investment positioning. During a trend, as such positions are being built up, one is better served by following the trend.)
There are a few select groups, however, that have historically been considered “smart money” due to their propensity to be correctly positioned at extremes. One example of a supposed smart money group is the collection of traders of S&P 100, or OEX, options. OEX options do not draw the attention or volume that they used to; however, the contract at times still generates some interesting signals at extremes. The OEX market is presently flashing one such extreme and, based on historical precedence, it may behoove traders to exercise a bit of caution here.
As of yesterday, December 29, the level of OEX open interest in Puts was more than double that of Calls. This is just the 15th time in the past 15 years that level has been breached.
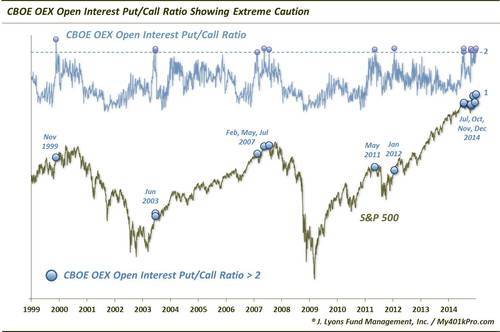
Open interest simply refers to options positions that are still active, i.e., that have not been closed out yet. As of yesterday’s close, the Put/Call ratio on OEX open interest was 2.08. As Put options represent bets that the market will decline, this represents a rarely seen level of pessimism on the part of OEX traders. And historically, they have proven to indeed be “smart money” when displaying such caution, as S&P 500 returns following these readings have been very poor relatively speaking.
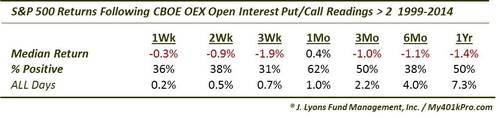
Median returns following these occurrences were negative from 1 week out to 1 year, except for the 1-month time frame. Additionally, except for that 1-month period, no more than 50% of these events showed a positive return over any of the time frames. Needless to say, this has not been a welcomed condition for stock bulls.
A look at the dates of the occurrences reveals some inauspicious periods. They include November 1999, June 2003, February-July 2007, May 2011 and January 2012. Of those, only the 2012 occurrence did not result in considerable market struggles at some point during at least the first few months.
The wild card is that now a full 7 of the 15 occurrences since 1999 have taken place this year, in July, October, November and now December. This is yet another in a long list unusual developments in the stock market this year. And while the market over the past 2 years has steamrolled many of these types of historically effective warnings, we would not dismiss it too readily.
Although certainly on a micro-level, conditions do change throughout time, we are loathe to adopt the “this time is different” mentality. We would argue that the jury is still out on this year’s signals. Furthermore, the S&P 500 was lower by 3-5% within weeks following both the July and November readings above 2. Therefore, this sign of caution among “smart money” options traders appears to still hold validity, even in this unusual environment.
________
“stairs with a warning” photo by shino.
More from Dana Lyons, JLFMI and My401kPro.


