Unprecedented Rally – Part 3

European Space Agency image of Comet 67P as seen from the Rosetta spacecraft which recently made an unprecedented landing on the surface of the comet.
Another day, another noteworthy data point from the current stock market comet that was launched from the latest V-Bottom. The current rally, now in its 4th day is the latest example of exceptional behavior in what has been an exceptional year. And like the recent landing on the surface of a comet, many of these happenings in the market this year present an unknown due to their either rare or unprecedented nature. We just don’t know what to expect until things play out.
Take the current rally for example. In Part 1, we explored how unusual it was to see a 90% Up Volume Day with the S&P 500 sitting above its 200-day moving average. In Part 2, we explored the back-to-back 2% Up Days in the S&P 500, from a historical perspective. Today, we show how exceptional a 3-day rally of at least 5% has been in the S&P 500, especially in light of the circumstances (for the accuracy police, the 3-day rally was technically only +4.96%...so for purposes of this study, we’re rounding up from 4.9% to 5%.).
Since 1950, there have been 16,339 3-day periods in the stock market. Just 71, or 0.43%, of those periods saw the S&P 500 rally each day by a total of at least 5%.
After some minor struggles in the first few days following these streaks, median returns were very solid in the intermediate to long-term.
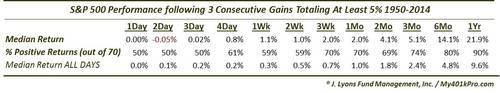
However, like the studies that we looked at last week, there was obviously quite a variance in the returns. As evidence, despite the median 2-week return doubling that of ALL days, the median 2-week drawdown was -2.1%, twice that of ALL days.
So is there a condition unique to those instances that did well following these streaks as opposed to those that did poorly? One factor in that determination may be in the S&P 500’s proximity to its cycle high at the time of the streak. This is noteworthy, considering:
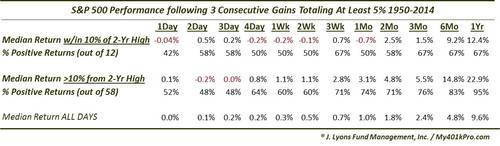
Of the S&P 500’s 71 3-day winning streaks of at least 5% since 1950, this is just the 13th that began within 10% of its 2-year high.
This statistic lends credence to the notion that most out-sized rallies occur within the confines of a bear market. Only 12 previous times has the S&P 500 rallied so sharply from within 10% of its cycle high. These moves have often marked an exhaustion, or beginning of an exhaustion, to a bull market move. And whereas many of the instances occurring during a bear market struggled for some time afterward as the market tried to regain its footing, in the long-term results thereafter were very positive.
Narrowing it down even further to those that closed at essentially a 52-week high (Friday was just 0.2% away), we see how exceptional again this current streak is:
Of the S&P 500’s 71 3-day winning streaks of at least 5% since 1950, this is just the 12th that closed within 1% of its 52-year high.
Interestingly, previous such occurrence came in bunches. 2 happened in 1955, then not again until 1980. There were several in 1982-1983 then not again until 1999-2000. This suggests there is something unique to the market environment that allows for such streaks to occur. Perhaps it should also tip us off to not be surprised if it happens again? At a minimum, it shows that it pays to be aware of the micro-trading environment that exists so that pattern recognition becomes easier and trading systems mare adaptive (i.e., the current “V-Bottom” environment). Here is a chart of all of the instances since 1980:
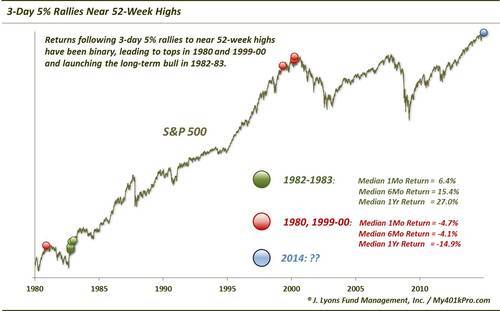
As the chart indicates, the results following these streaks at 52-week highs have been binary. Those that occurred in 1982-1983, and 1955 to some extent, represented a launching or acceleration of an emerging bull market. Conversely, those occurring in 1980 and 1999-2000 indicated an exhaustive condition to the respective bull markets. Here are the prospective returns following these prior 11 occurrences:
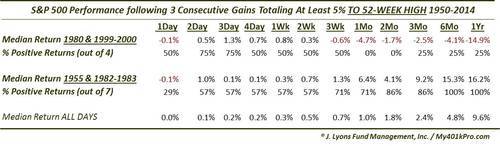
So which outcome will this event be more similar to, if any? There’s obviously no way to tell, and that is part of our point. The results have been binary – very good or very bad, at least in the long-term. And while we did pick and choose the breakdown of the years in the chart and table, we will make one additional point. While there is no way of knowing if we are at or towards the end of the post-2009 cyclical bull market, it is very difficult to argue that we are at the initial stages of a cyclical bull, ala 1982. Therefore, if we had to lean one way, it would be toward the 1999-2000 events.
Lastly, one additional piece of exceptionalism to this 3-day streak was in the level of the Volatility Index.
Of the S&P 500’s 43 3-day winning streaks of at least 5% since the VIX began trading in 1986, this was the lowest level of the VIX, 23.57, ever at the beginning of a streak.
Breaking down those streaks that began with the VIX below 40 versus above 40 is a bit interesting.
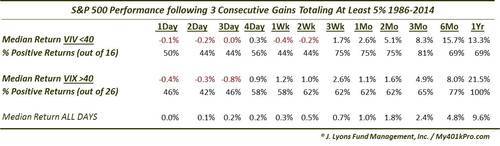
Those streaks occurring with a low VIX struggled a little in the immediate aftermath of the streak but did well in the intermediate-term, gaining over 15% in 6 months, on a median basis. However, that was the peak as median 1-year returns were actually worse. Those with high VIX’s struggled to get much going for the first couple of months. However, 1 year out, all 26 instances saw the S&P 500 higher, by a median of more than 20%.
Again, it is difficult to glean much from some of 2014’s rare and, at times unprecedented, events…except that these are unusual times. We may not know all of their implications for a long time. For now, it appears as though Santa has traded his sleigh for a comet. Thus, there may still be more installments of the Unprecedented Rally.
________
More from Dana Lyons, JLFMI and My401kPro.


