The Most Important Chart In Foreign Equities Threatening Major Breakdown
On October 17, at the depths of the October global equity sell off, we posted that “International Stocks Were Testing Major Support”. The post was in reference to the MSCI EAFE Index (Europe, Australiasia and Far East), probably the most widely followed international stock index. The EAFE was testing (and slightly undercutting) a major confluence of Fibonacci Retracement levels at the time. We stated in the post:
We are not fans of trying to catch falling knives. However, when we do, it is only into significant support. The MSCI EAFE is testing the strongest possible cluster of Fibonacci Retracement support. If it can reclaim the 1740ish level, it could set the index up for a significant rally, at least in the intermediate-term.
The EAFE did indeed reclaim that level the very next day and was able to rally some 9% over the subsequent 6 weeks (before it ran into resistance). In mid-December, the EAFE tested the October lows again before bouncing (to a lower high) into the end of the year. And yesterday, the index revisited the lows yet again. As the saying goes, the more times a level gets tested, the more liable it is to break, particularly if the period between tests is getting shorter. Should the MSCI EAFE break this support, it could be a major bearish development for stock markets globally.
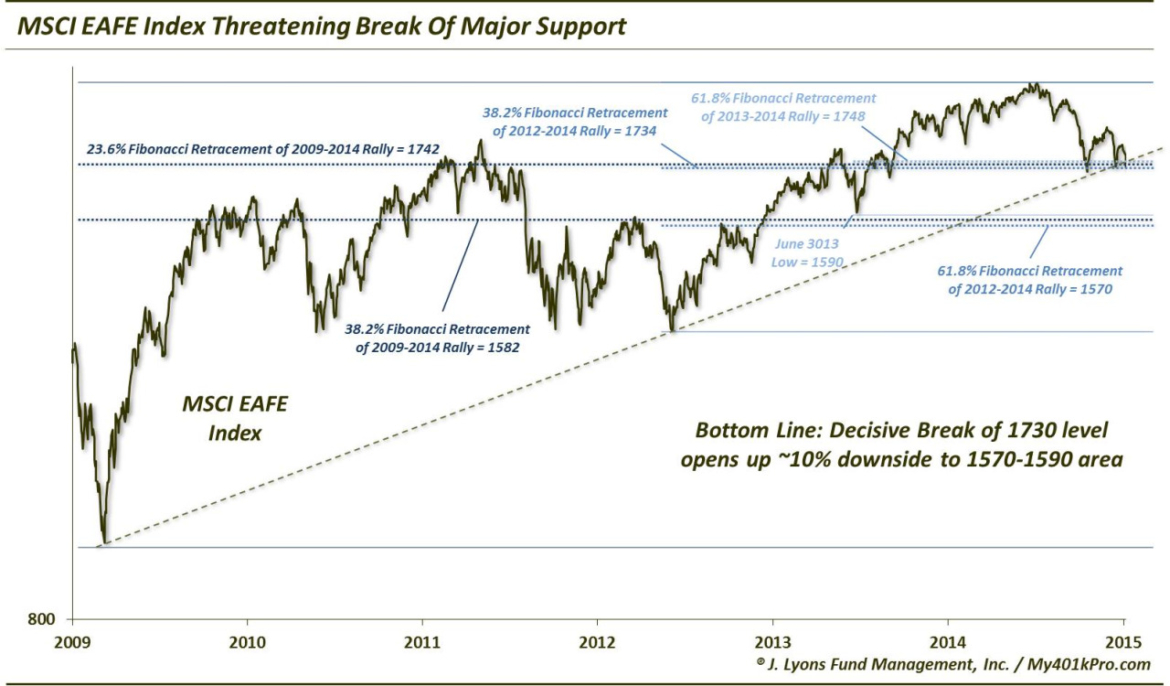
As we mentioned in the October post, the Fibonacci confluence near the 1730-1740 area includes these levels:
- 23.6% Fibonacci Retracement of 2009-2014 Rally ~1742
- 38.2% Fibonacci Retracement of 2012-2014 Rally ~1734
- 61.8% Fibonacci Retracement of post-June 2013 Rally ~1748
On top of those Fibonacci levels, a decisive break of this area would also break the up trendline connecting the 2009 & 2012 lows, on a logarithmic scale. Should this breakdown occur (as the EAFE is threatening to do today), it would open up roughly 10% more downside to the next major support area. That support area around 1570-1590 is based on the next levels in the Fibonacci sequence from the aforementioned lows:
- 38.2% Fibonacci Retracement of 2009-2014 Rally ~1582
- 61.8% Fibonacci Retracement of 2012-2014 Rally ~1570
1590 was also the area of the June 2013 low. Furthermore, a 161.8% Fibonacci Extension below the range of the October to November rally would put the EAFE precisely in the 1590 area.
While a 10% drop may not seem like the end of the world, it would signify the loss of the entire rally since June 2013. Additionally, while the break of the post-2009 trendline doesn’t necessarily kill the cyclical bull market, it does seriously weaken it. On top of that, should the U.S. (finally) experience a correction of its own, the negative reverberations could certainly effect the foreign markets.
That is why this is the most important chart development we are monitoring at this moment in time.
__________
More from Dana Lyons, JLFMI and My401kPro.