What Does The Big Drop On The Last Day Of The Year Mean?
For just the 5th time since 1950, the S&P 500 dropped at least 1% on the last trading day of the year. We looked at the previous 4 incidents to see if there was any pattern to the market performance going forward. We will emphasize the following caveats regarding the study.
- A mere 4 precedents is not enough to produce any statistically significant conclusions for us.
- Year-end dynamics can produce market action that is more related to re-balancing, re-positioning, tax considerations, etc than it is to the organic trend at hand.
- Due to new year dynamics, January is a goofy month and often produces counter-trend action.
We still took a look to see if there were any interesting results. There were.
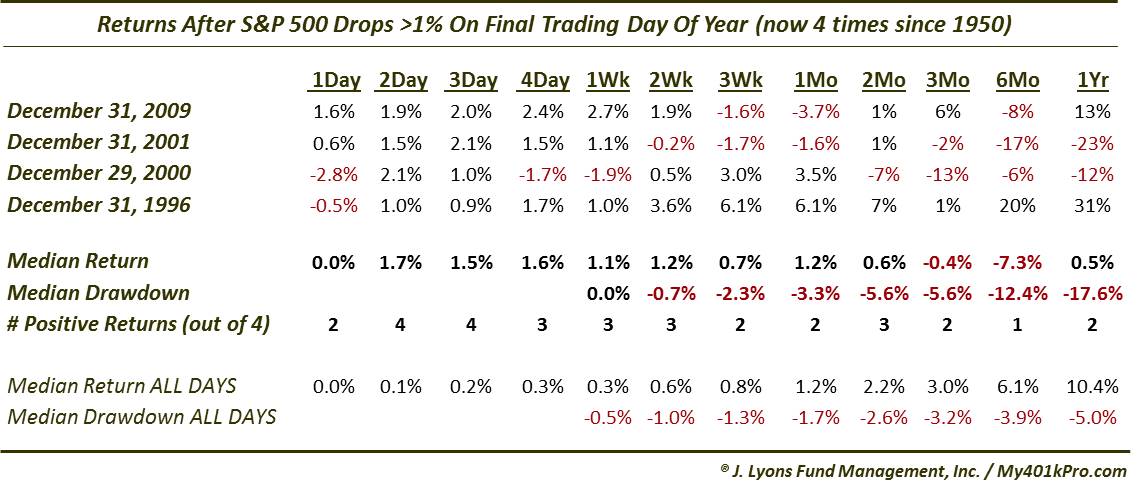
The 4 dates that saw 1% drops in the S&P 500 were 12/31/1996 (-1.7%), 12/29/2000 (-1.0%), 12/31/2001 (-1.1%) and 12/31/2009 (-1.0%). Although we show the subsequent returns out to 1 year, we thought it was a stretch to extrapolate anything further out than 1 month from one day’s market action (even that may be a stretch). So we focused on returns out to a month, as shown in the chart. Here are some interesting tidbits that we found:
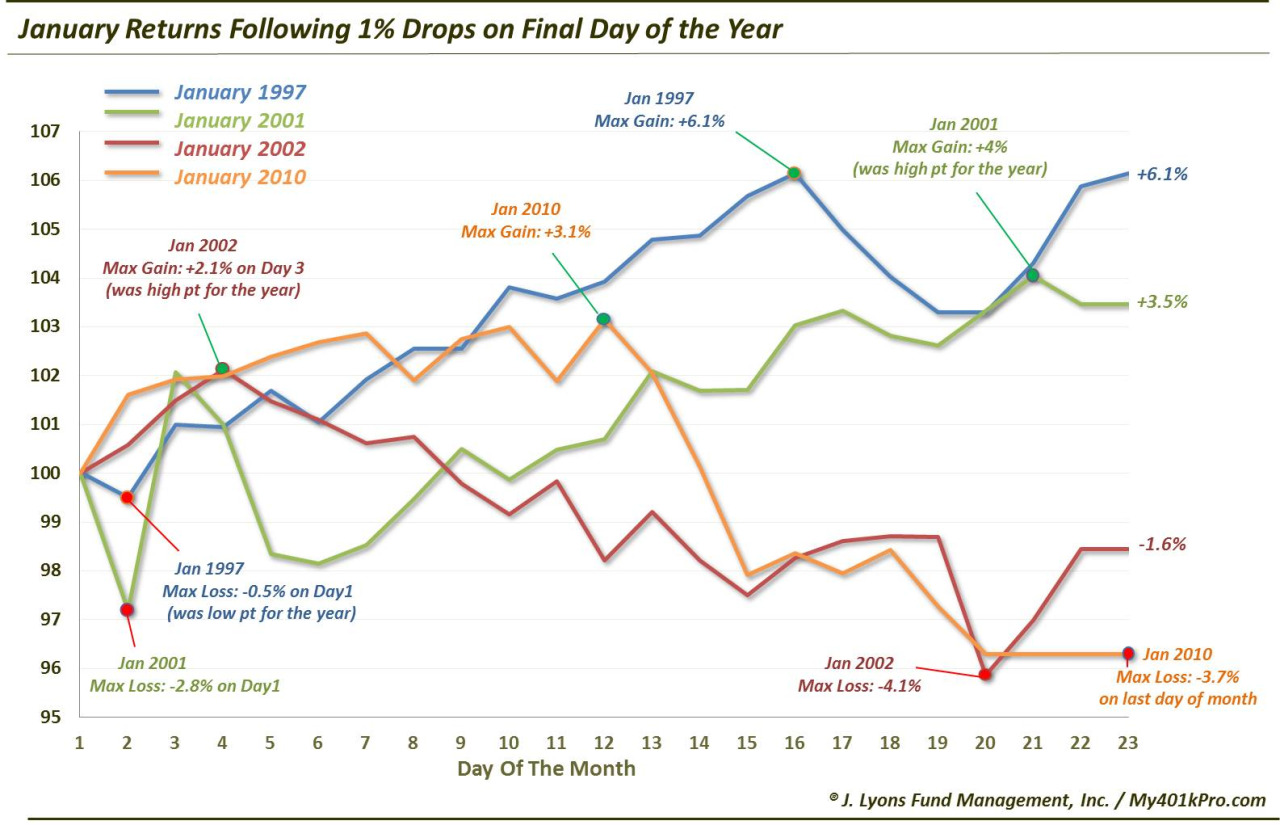
- 2 Januarys showed gains, 1997 (+6.1%) and 2001 (+3.5%) and 2 Januarys showed losses, 2002 (-1.6%) and 2010 (-3.7%)
- The 2 Januarys that showed gains, 1997 and 2001 were each down the 1st day of the month, by -0.5% and -2.8% respectively. Each time, that was the low point for the month.
- The 2 Januarys that showed losses, 2002 and 2010 were each up the 1st day of the month, by +0.6% and +1.6% respectively. January 2002’s max gain came on day 3 (+2.1%) and January 2010’s max gain came on day 12 (+3.2%).
- January 1997’s day 1 loss of -0.5% marked the low point for the year.
- January 2002’s day 3 max gain of +2.1% marked the high point for the year.
- January 2001’s max gain of +4.0% on day 21 marked the high point for the year.
- All 4 Januarys were up after 2 and 3 days.
- The median January drawdown among the occurrences was -3.3%, double the historical median for all months.
- 3 of the 4 occurrences (1997 was up) saw 6-month losses, with a median loss of -7.3%.
One final note is that when making historical comparisons, when possible we like to make our best attempts at doing so with periods at similar points in the market cycle. The 4 precedents do not really match up with where we are currently. 1996 had similarities in that it was coming off a very strong 2-year period. However, it was also in the meat of a secular bull market. 2000 marked the top of the secular bull, however the market had been weak for the last 4 months of the year, at least, whereas we are just off the highs now. 2001 only bore resemblance in its strong 3+ months ending the year. 2009 was a strong year, like 2014; however, it was coming off of a cyclical low.
Our takeaway is that there are some pretty interesting statistics following the 4 previous times the S&P 500 dropped at least 1% on the final day of the year. Generally, returns were above average in the short-term and poor in the longer-term. However, again, we are not going to put a ton of stock into this study, for the caveats that we listed above. These are perhaps mostly trivial data points. However, *IF* the market were to follow the historical template, it would appear that bulls should be hoping for a down day today as it relates to January’s performance.
________
More from Dana Lyons, JLFMI and My401kPro.


