Is The Recent Losing Streak Cause For Concern?

There has been much consternation surrounding the market’s recent losing streak, particularly regarding the timing of the decline. Much of the focus is due to the losing streak coinciding with the “Santa Claus Rally” period and the period covering the first few days of the New Year. The seasonal implications have been covered at length by others, including on the YFC platform. From what we can tell, there is ample historical evidence to justify some consternation about the market’s prospects, even though we would place seasonality toward the bottom of our list of investment decision-making considerations (though, ahead of fundamental factors).
If you hadn’t heard, 2014 had the distinction of being the first year in the history of the S&P 500 in which the index did not suffer a single 4-day losing streak throughout the year. It took 2015 just 2 days to claim its first 4-day losing streak (thanks to the final 2 days of 2014 being down.) Including yesterday, the streak has run to 5 days in a row. The focus of this piece is simply on the 5-day losing streak in the S&P 500 in general and what implications it may have going forward, if any.
Since 1950, there have been 226 5-day losing streaks in the S&P 500 prior to the recent one, which works out to about 3.5 per year. Returns following the streaks were pretty close to normal out to 6 months.
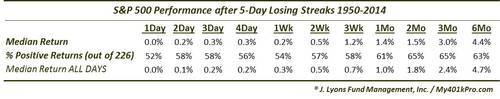
Not much of an edge there. We also looked at such streaks when the S&P 500 was in a bull market, as signified by being above the 200-Day moving average, as it is today. Returns were again pretty normal.
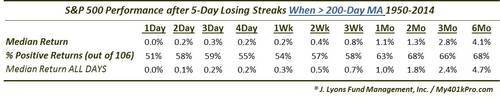
Median returns were actually slightly better when the S&P 500 was below its 200-Day MA, especially out to 1 year (not shown). Not much of an edge here though either. How about losing streaks coming directly off of a 52-week high, such as the current streak?
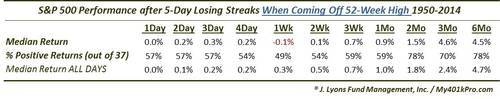
Again, not much distinction there. A little weaker at 1 week and a bit stronger at 3 months. Mostly, returns were normal, although the % of positive returns was slightly higher. What about just those occurring in January? There have been 13 previously. Returns following those occurrences actually did deviate from the normal pattern somewhat.
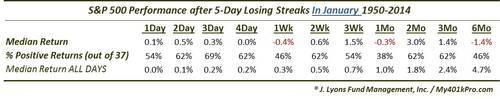
Although there are just 13 precedents, the median return 6 months later was negative. So that’s the first distinguishing factor that we found in examining these streaks.
Considering today is looking to be a positive day, it appears as though there will not be a 6-day losing streak. Of the 226 total 5-day losing streaks, just over half of them (119) did end at 5. Returns following these instances again did not provide much of an edge, subsequent to the initial up day.
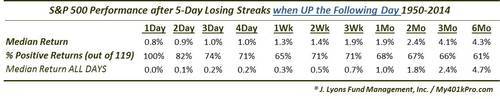
Even those that saw “day 6” up more than 1% as today is threatening did not provide any edge going forward. We also looked at returns based the magnitude of the loss during the 5-day losing streak. The recent streak lost 4.2% which put it precisely at the 50% percentile for such streaks. Returns following losses of at least 4% again held no real edge either going forward.
Here is a chart of some of the forward returns we looked at above:
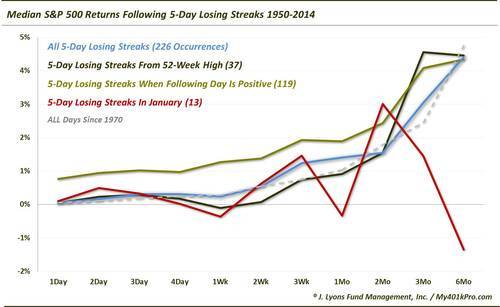
There have been so many unusual occurrences in the market lately that at times, we haven’t known where to begin to study. In this instance, the only thing unusual about the results was the lack of unusual results. We are only 4 days into the new year and already it is looking more “normal” than all the craziness of 2014. In the above chart, certainly the “January” instances of 5-day losing streaks sticks out when looking at the 1-6 month returns. However, there are just 13 precedents so it is hard to read too much into it. The other seasonal January patterns that folks have pointed out based on recent weakness probably hold more relevancy than this study.
At times, we examine market patterns only to find out, there’’s nothing to find out. At least, as we’ve said before, we know what not to lose sleep over.
________
More from Dana Lyons, JLFMI and My401kPro.


