Options Traders Growing Their Hedges

Last Thursday, we mentioned that traders in equity options on the International Securities Exchange exhibited a rare (though recently, less-so) display of cautious behavior on back to back days. After a more fervent foray into call options on Thursday’s ECB QE announcement day, Friday showed a return to tepid behavior on the part of options traders. And it was not just seen on the ISE, but also in the Chicago Board Options Exchange figures as well. In fact, the combination of option volume across the two exchanges reached seldom seen levels.
The ISE reports their options ratios with the call volume in the numerator (i.e., call/put ratio) while the CBOE reports theirs with the put volume in the numerator (i.e., put/call ratio). A simple way to combine the two is to divide the CBOE Put/Call ratio by the ISE Call/Put ratio. In this calculation, since a high CBOE Put/Call ratio represents relatively high put volume and a low ISE Call/Put ratio represents relatively high put volume as well, the higher the combined figure is, the more aggressively traders are trading puts as opposed to calls. Thus, presumably the more hedging they are doing. On Friday, this ratio reached 2.00 for just the 16th time in the 12 years of data (all since 2008). (Note: the ISE reports their ratios as whole numbers as opposed to percentages; therefore, we moved the decimal point 2 places to the left to arrive at the appropriate calculation.)

As it may be gathered from the chart, most of the previous signals came during times of market stress, at least moreso than we are witnessing presently. That makes this reading a bit unusual. Nevertheless, we’ll take it at face value until proven otherwise. And based on history, that suggests that while there may be some challenges for the market in the short-term, the intermediate-term should see favorable market action.
Specifically, the median return in the S&P 500 out to 2 weeks after the previous 15 events was negative. However, after a few weeks, returns were much stronger than typical returns, as shown in this table.
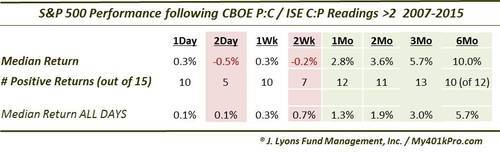
As we mentioned, most of the prior examples occurred during market stress as corrections were still struggling to find a bottom. These included occurrences in January and March 2008, May 2010, August to November 2011, May 2012, June 2013 and October 2014 among others. Interestingly, The current reading makes 4 in the last 5 months. This is interesting considering the overall lack of downside pressure during that time. Perhaps this in an indication that traders are wary of the present environment despite the continuing uptrend in the averages. And perhaps the fact that they appear to have one foot out the door is allowing the uptrend to persist.
Whatever the reason for the readings that we saw on Friday (and in recent months), like we said we will take them at face value until the market suggests that we not. We are, after all, quantitatively oriented and despite our own unease with much of the market action at these heights, we will always defer to the objective data. That data suggests that while the market may be challenged in the near-term, the next few months should see higher prices.
______
“Dark Hedges” photo by Andrew Gibson.
Read more from Dana Lyons, JLFMI and My401kPro.


