This Global Economic Indicator Just Hit A 30-Year Low

Our post and Chart Of The Day on Tuesday focused on the 5-Year Breakeven Inflation Rate. The impetus for mentioning it was due to the rate hitting its lowest levels since its inception in 2003, other than during the financial crisis. The point is that the indicator is signaling the lowest inflation, and greatest threat of deflation during that time. We also mentioned that we would try to avoid further rare (and unwelcomed) forays into the economic realm, as opposed to our usual financial market turf. Well, that attempt lasted a whole 3 days.
While the subject of today’s Chart Of The Day is not an explicit economic indicator, the message behind its behavior is inexorably tied to the global economic outlook. And the message it is sending is similar to that of the 5-Year Breakeven Inflation Rate currently. The Baltic Dry Index is a composite of various global shipping rates tied to the movement of raw materials. Thus, the price of the BDI is an indicator of the level of global demand for shipping raw materials, specifically. It is also considered by many to be an indicator of the level of global economic growth, in general. If that is indeed the case, it is not good news for the global economy since the BDI dropped yesterday to $632 the lowest level in almost 30 years. And but for a few months in 1986, it would be a record low in its history.
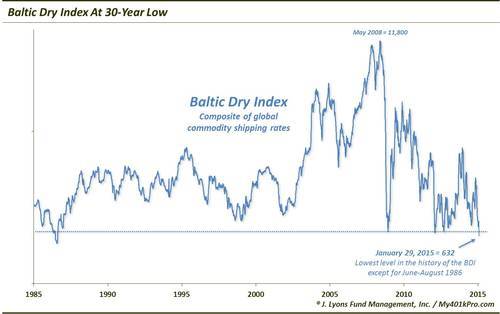
Given the recent decline in the price of many commodities, the fact that the Baltic Dry Index would be at depressed levels is not a surprise. Like any other market measure, the BDI is a function of supply and demand. In this case, there are basically two factors involved: ships and cargo. With the supply of ships typically at a fairly constant level, it comes down to the cargo, in this case, raw materials. And with materials prices dropping, so too should the BDI. Conversely, the BDI hit an all-time high around $11,800 in 2008, concurrent with the Chinese-led bubble top in many commodity prices.
The curious thing is the fact that the BDI has dropped below the floor around 650 that it held in 2008 and a few times in 2012. At those periods, prices here actually marked a low-point of sorts and upside opportunity across many assets. We don’t know for sure but we expect the breakeven level for shipping operators must be somewhere in the vicinity of that 650 level, given the fact that it held there so precisely. The fact that it dropped below now is that much more telling. This is especially so given the fact that even with the sell off, most commodities are still comfortably above their 2008-2009 lows. That would suggest that there is also a weak demand dynamic in play here as well as merely low prices for materials.
So what should folks make of this development in the Baltic Dry Index, assuming they are not directly involved in international shipping of raw materials? The BDI is one of those things that became fashionable to talk about in financial circles, even if nobody really knew what it was or what its implications were. Its sudden popularity arose during the materials boom in 2008. And to be honest, despite its intriguing concept, we had no idea what to do with it either. So we actually took a further cursory look at its correlation traits to see what, if any, benefit it has as an indicator.
Running a scan of the BDI correlation versus our universe of global indexes over the past decade or so, we found that, surprise, it is most correlated with companies dealing in raw materials and industrial metals and the like. Just what you’d expect. Therefore, it is a decent gauge of the performance and potential of those industries. And if the well-being of these companies is an accurate gauge of the broader economic outlook, then perhaps the BDI is indeed a fair global economic barometer.
Interestingly, the batch with the next highest correlation with the BDI was a collection of European stock markets. Given that these markets have fluctuated with the global economy, as the BDI has, much more so than, say, the U.S. market over the past 5 years or so, this is another head’s up that the BDI may be a decent indicator of economic growth. For example, in 2012, many of the European markets hit major lows along with the BDI while the U.S. market was able to come away relatively unscathed.
Lastly, the other highly correlated market over the last 10 years is China with a roughly +0.6 correlation coefficient. Given the aforementioned Chinese-driven commodity bubble in 2008 which spiked the BDI, this is not surprising. The surprising thing is what has happened over the past 6 months. As commodities and the BDI have collapsed, the Shanghai Composite has soared. In fact, the two have a negative 0.6 correlation coefficient over that time. We don’t know what’s behind this…but something is different.
So what’s the point? If you’ve always ignored the Baltic Dry Index, feel free to continue to do so. We are not going to ingest it into our investment risk models either, since we pay very little attention to economic indicators anyway. However, the message behind the BDI plumbing new 30-year lows is straightforward. Like with the 5-Year Breakeven Inflation Rate, the BDI is sending deflation warnings. And whether or not the BDI is a sound global economic indicator, the deflationary signal is reason enough for some concern.
________
“SHIPWRECK” photo by Marckles55.
More from Dana Lyons, JLFMI and My401kPro.


