Broad Stock Index Breaking Above 3-Decade Triple Top?

Back in July we posted a provocative chart of the Value Line Geometric Composite (VLG). The VLG is a broad index of approximately 1800 stocks and is unique in its construction as is it essentially unweighted. That is, all stocks are counted equally and, therefore, its movement is not dominated by just a few of the largest issues. Because of that, it is a good gauge of the strength of the overall broad U.S. stock market. If it is doing well, it is an indication that the majority of all stocks must be doing well. As we are strong proponents of the importance of market breadth, that can be an indication that the broad market is on solid footing.
Getting back to the July chart, here’s what we observed. After topping out at almost the exact same level (508) in 1998 and 2007, the VLG was back to that level on July 1. Thus, on July 2, we posted the following as our Chart Of The Day, wondering if the index was positioned to form a triple top spanning three decades.
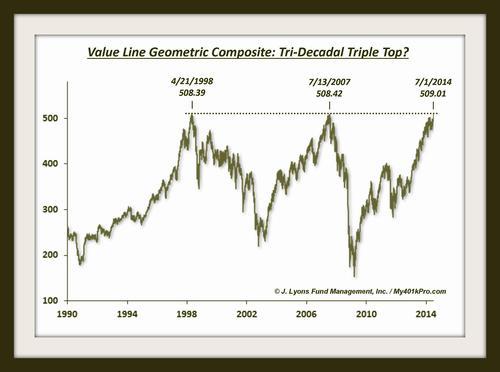
With all the averages hitting new highs at the time, we considered the odds to be quite low that the VLG would stop right at this level for the third time in 3 different decades (we assessed the odds at .006%). Nevertheless, a tri-decadal triple top in a broad U.S. index would be an epic development, so we could not resist at least pointing out the potential. Furthermore, we doubled down on the potentially epic event by titling the post “The Most Significant Chart Event Of This Era?” How’s that for hyperbole – especially for a chart event that had not happened yet?
Well, the VLG did not top on that day. But it did top the following day! And in fact, the index failed to surpass that level in 7+ months since. On October 6, as the U.S. stock indexes were breaking down a bit, we posted an update to the chart. In the post, we pointed to a break of a potential head-and-shoulders pattern in the VLG and a possible downside target level based on it. Due to the negative setup, and the fact that it was then roughly 9% below that triple top level, we raised the odds of our triple decade triple top “call” coming to fruition to 0.6% (based on unscientific analysis).
In the mid-October swoon, the VLG did reach that downside target that we indicated. Like all indexes, the VLG immediately “V-Bottomed” and roared back. Finally, this week, after spending 7 and a half months below that triple top level, the Value Line Geometric Composite has moved to a new all-time high. And while it is not a decisive new high (still less than 1%), it has closed above the prior tops for 3 straight days. Boo hoo.
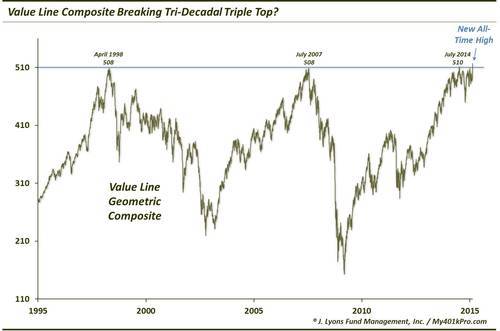
So besides putting an end to our spectacular (albeit extremely far-fetched) vision of a real-time most significant chart event of the era, tri-decadal triple top, what is the significance of this development? Assuming the “breakout” does not immediately fail, it is at least for the moment a bullish development. Recall that this is an index of some 1800 stocks. Even if the index does not have “memory” regarding the prior top levels (we think it does – how else would you explain the exact double and temporary triple top?), it is still indicating that the majority of stocks are still on the upward path. And more so than in September and July when the VLG reached similar levels.
Additionally, unlike the 1998 and 2007 tops which saw the index spike up and immediately fail, the VLG has been bouncing around these levels for several months. This suggests that it has a much better chance of eventually breaking (meaningfully) higher above these levels than at those prior tops.
We have no shortage of longer-term concerns about this stock market, as readers have likely become aware. However, this is another indicator (like the NYSE Advance-Decline Line and the Equal-Weight S&P 500 and the Small and Mid-Cap Indexes) that has now gone to new highs. It is possible that the market can top amid such conditions – but it is not probable. More likely, despite our longer-term worries, the market is still on OK ground here in the intermediate-term.
________
More from Dana Lyons, JLFMI and My401kPro.


