Heavy Selling For Such A Small Loss

On the surface, yesterday was a pretty nondescript day in the U.S. equity market with the major averages showing slight gains or losses. About the only suspense (at least in the financial media) was whether the Nasdaq would reach the “all-important” 5000 level. Upon further introspection, however, the day did produce a few interesting developments. For one, the iShares Russell 2000 ETF (IWM) closed higher for the 10th consecutive day. This was just the 2nd time in its history that the IWM has been able to put such a streak together. June 4, 2003 was the other time it reached 10 straight days. That streak ended at 11 and, for what it’s worth, the index went sideways for the next 2 months.
The second interesting thing that struck us yesterday was the disproportionate level of volume that went into declining issues on the NYSE relative to advancing issues. Despite the fractional loss in the S&P 500 (-0.15%), declining volume was twice as heavy as advancing volume (actually, 1.97 times but we’ll take a little license there). Looking historically, our initial observation that this seemed fairly disproportionate given the size of the S&P 500 loss was confirmed.
In the last 50 years, there have been just 21 other days in which the S&P 500 either closed higher or lost less than 0.16% on declining volume that was double advancing volume.
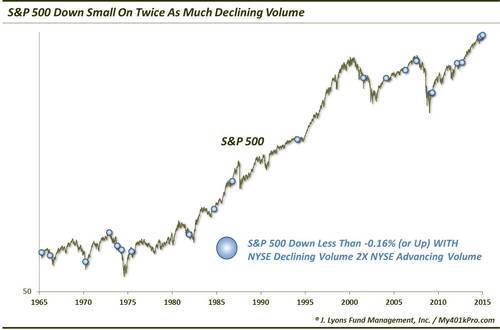
This set of circumstances has been rare indeed, occurring less than once every 2 years. Incidentally, the average loss for the S&P 500 on a day when NYSE Declining Volume is 200% (+/-5%) of Advancing Volume is -.61%. What makes this statistic even stranger is the fact that some of the broader averages (e.g., Russell 2000) were actually up on the day. So it was not simply large cap relative strength masking an ugly day. One might argue that the preponderance of bond-type issues on the NYSE may have had a large influence on the relatively heavy volume yesterday. They may have a point considering the decline in the bond market. However, these issues are not typically among the heaviest-traded on the NYSE.
So we don’t really have a great explanation for why it occurred (outside of heavier volume in some of the bigger stocks that fell on the day). But is there any significance to the fact that it did occur? That is, does it imply anything for the markets going forward? Well, even more so than some of the studies we’ve looked at lately, we don’t want to overemphasize the importance of a 1-day development like this. This is especially true given the small sample size. However, if there is a takeaway from the prior 21 occurrences, it is the consistent weakness in the short-term.
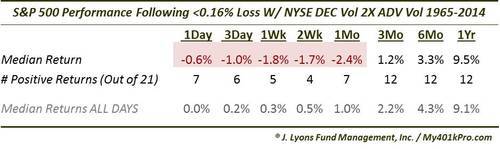
From 1 day to 1 month afterward, median returns in the S&P 500 were negative. 17 of the 21 occurrences saw the index lower after 2 weeks. By 1 month out the median return was a not inconsequential -2.4%. Longer-term, there was no measurable impact as one might expect given the 1-day nature of this data point. Yes, a few of the occurrences happened within days or weeks of cyclical market tops (e.g., 1973, 2007). However, it would be a reach to extrapolate a 1-day event like this as a major long-term sign of distribution.
Thus, we will take the development for what it likely is: a potential slight headwind for the market, and only in the short-term, but mainly an interesting and unusual data point from a rather pedestrian day in the market.
________
More from Dana Lyons, JLFMI and My401kPro.


