Investors Are Fleeing The Largest ETF Near Its High

In the world of ETF’s, one way to measure investor demand is by looking at the number of shares outstanding. Unlike a stock or closed end fund, the amount of shares outstanding is not static for an ETF. If demand is strong, the ETF provider can create new shares to satisfy demand. The same holds true for redemptions. In the case of significant selling, the provider can redeem, or reduce, the number of shares outstanding. Typically, in the short-term, the number of shares will trend in the direction of the ETF as investors either chase performance on the upside or flee from a fund that is declining. It is therefore odd to see the number of shares outstanding in the world’s largest ETF, the S&P 500 SPDR (SPY), well off of its recent high considering the ETF’s NAV is very close to its 52-week high (hat tip to one of the best researchers in the business, Jason Goepfert at sentimentrader.com, for pointing out this development recently).
Specifically, although the SPY closed barely 3% below its 52-week high yesterday, the amount of shares outstanding was down over 13% from its recent 3-month peak. The SPY’s provider, State Street Global Advisors, has made available daily information on the number of shares outstanding in the ETF since 2006. Since that time, there have been nearly 1000 days in which the SPY has closed as close to its 52-week high as it did yesterday. Of those, only 86 now have occurred while the number of shares outstanding was at least 13% off of its 3-month high.
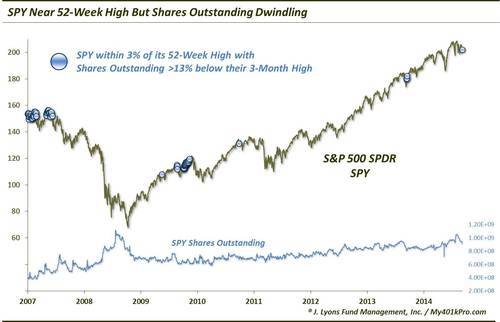
As the chart illustrates, most of the past events occurred in clusters in 2007 and 2010, with a few others in 2009, 2011 and 2014. So what sort of returns did these events lead to? To be honest, when we learned of this phenomenon, we thought it was going to be a bullish study, on a contrarian basis. Boy were we wrong. Here are the returns in the SPY following all such days.
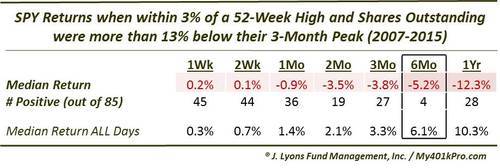
As the table shows, median returns were negative across the board, from 1 week to 1 year. Again, being that many of the instances were clustered around two periods, some redundancy in returns is not surprising. However, the uniformity over some of the durations is still pretty alarming. Just 19 of the previous 85 occurrences were positive 2 months later and just 28 were positive a year later. Then there are the 6-month returns.
Of the previous 85 occurrences, the SPY was positive 6 months later exactly 4 times. Let me repeat that. 4 of the 85 prior occurrences showed a positive 6-month return afterward. FYI, those 4 were the lone occurrence in October 2009 and the 3 in February 2014.
Once again, due to the vast majority of the occurrences happening in 2 bunches, we are not going to get overly “beared up” over this. However, it certainly did not turn out to be the bullish contrarian signal that we expected. Whatever the dynamics are that are contributing to this reduction in shares outstanding with the ETF near a 52-week high, if we must choose, past results compel us to view it as a negative development.
________
“Xtreme Bugs” photo by swimflnfan.
More from Dana Lyons, JLFMI and My401kPro.


