Key Market Gauge Hits All-Time High

You’ve heard me mention many times that we consider breadth, i.e., the number of stocks advancing versus declining, to be an important barometer of the market’s overall health. The more stocks that are advancing, the healthier the rally. One way to measure market breadth is by looking at indices on an “equal-weight” basis. Again, an equal-weight basis is just that: it places an equal weight on each of the components in the index as opposed to placing greater weight on those stocks with the largest market cap. This way, it is easier to tell if there is broad participation across the whole market or sector rather than perhaps just a few of the larger-cap issues leading the way.
Thanks to the Rydex/Guggenheim family of funds, we can easily monitor these equal-weight indices through ETF’s. We looked at one example the other day in the Equal-Weight Materials ETF (ticker, RTM). While the broad materials index has been lagging, RTM was hitting an all-time high. As of yesterday, we can say the same thing about the Equal-Weight S&P 500 ETF (ticker, RSP). It too is now at an all-time high.
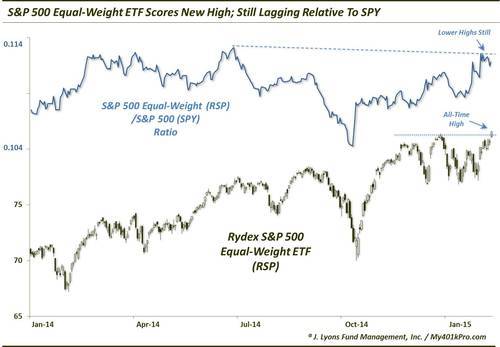
As the chart shows, after moving sideways for the past few months, the Equal-Weight S&P 500 broke out to a new all-time high. This again is important considering it takes all constituents equally into account. Thus, if the ETF is at an all-time high, the majority of its components must also be doing well. This is good news for the broad stock market at the present time.
If there is a chink in the armor here, it is in the relative ratio of RSP to the S&P 500 (specifically, we are using the SPDR S&P 500 ETF, SPY). Despite the new high in RSP, its ratio versus SPY has not yet surpassed the high it made last June. We have seen this sort of divergence before (i.e., RSP goes to a new high but the RSP/SPY ratio does not), generally near tops in the market. For example, in 2007 (not shown) the RSP/SPY ratio peaked in February. Meanwhile, the RSP continued to make new highs into June. Of course, the market topped soon afterward.
We are not saying that the RSP/SPY ratio must confirm the new highs or else the market will collapse. If asked which was more important, the absolute price or the ratio, we would say the absolute price of the RSP. It is unquestionably a bullish sign to have it hitting all-time high ground. We are simply pointing out the fact that conditions are not “perfect” (when are they?), despite the breakout. The ratio divergence in the past has been a good warning sign of danger in the market. That’s why we bring it up.
The main takeaway, however, is a bullish one. The fact that a broad index like the equal-weight S&P 500 is making an all-time high suggests that the rally is healthy and that the market top is not imminent. Of course the market can top at any time. However, history would suggest that, like with the NYSE Advance-Decline Line, any market decline would likely result in at least 1 more eventual marginal new high in the S&P 500 before THE top is in.
________
“Vintage Scales” photo by Cool Kats Photography.
More from Dana Lyons, JLFMI and My401kPro.


