Seasonal Trend Says Date This Market, Don’t Commit

The stock market chop continued last week with major indices rallying from the bottom of the 2-month range to back near the top. With Valentine’s Day approaching, folks are wondering whether to “heart” this market or dump it. One seasonal pattern that we looked at suggests that traders should consider dating this market…but should not make a commitment. Here’s what we mean.
Many readers are likely aware of the January Barometer, i.e., as goes January, so goes the rest of the year in the stock market. This adage has a decent track record, although it has been rather unreliable as of late with several down January’s not resulting in losses over the following 11 months. As it turns out, adding another data point may help investors distinguish the potential losers from winners following down January’s – if they can wait another week. After posting a loss of nearly 4% in January, the Dow Jones Industrial Average (DJIA) rebounded strongly last week, the first week of February. We found that this combination has generally shown in 2 tendencies, historically:
- Strength has tended to persist through February, and
- Weakness has tended to follow over the rest of the year
Specifically, there have been 13 years prior to this one in which January showed a loss of at least 3% and the first week of February rebounded by 1% at some point during the week. The median return from that high point during the first week until the end of February was +1.2%. Conversely, the median return from that high point during the first week until the end of the year was -1.2%.
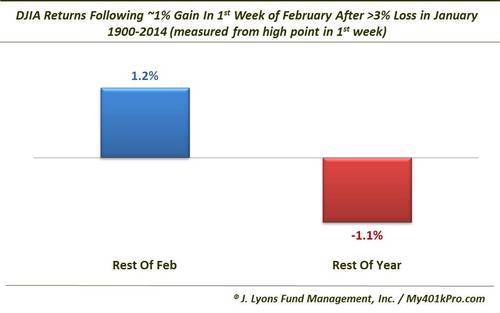
While these figures may not seem like a big deal, the difference from the average of all February’s and all February-December periods is significant. Consider that the median return for all years during the (entire) month of February is +0.5%, +1.2% is significantly higher. This is especially so considering that the returns are measured from the high point during the first week of February, i.e., the market has already rallied a fair amount during the month. Additionally, 8 of the 13 instances showed positive returns over the course of the rest of the month.
Likewise, the median returns over the duration of the year are statistically significant when considering the median return from the 1st of February through the end of the year is +6.5%. And given the positive median gains during the rest of the month of February in these occurrences, returns are even that much worse from the end of this month into year-end. Of the 13 instances, 7 turned in losses into the end of the year.
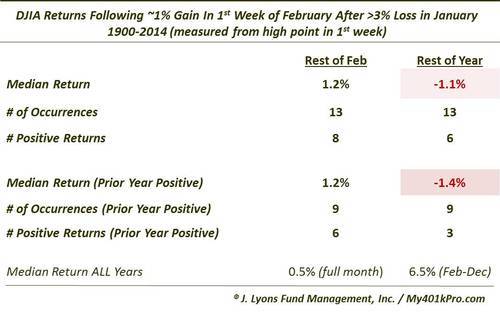
Adding one further input into the mix increases the losing percentage among this sample into year-end. If we include just those years that saw positive returns the prior year (as in 2014), it cuts the sample size down to just 9. The “rest of February” median return remains +1.2% with 6 out of 9 winners. The “rest of the year” median return drops slightly to -1.4%. But just 3 of the 9 years saw gains into year-end.
Here is a table of the statistics for these occurrences.
You may be wondering what happened during those years that instead saw continued weakness into the first week of February after weak January’s. i.e., was there really any difference anyway? Yes, there was. During those 12 years that saw January losses of at least 3% and continued weakness into the first week of February, the median return during the month of February was a negligible +0.3%. However, those 12 years showed a median return from February to December of +17%. Now that would be something worth committing to.
As it stands, at least from the perspective of this seasonal tendency, traders may only want to have a fling with this market.
________
“be my valentine” photo by Martin Fisch.
More from Dana Lyons, JLFMI and My401kPro.


