The S&P 500-VIX Standoff – Part 2

Earlier this month, we looked at the circumstances present at the time whereby the S&P 500 and the VIX (S&P 500 Volatility Index) were both near 52-week highs. Since the two typically move in opposite directions, the behavior struck us as peculiar. So we looked into it further to see if it was indeed an unusual situation. It was. As it turns out, it marked just the 5th unique occurrence since its inception that the VIX’s 10-week moving average was at a 52-week high at the same time the S&P 500 was within 2% of its own.
The question, we pondered, was which one would blink in the standoff? While the jury may still be out, thus far it looks like it was the VIX that has blinked. While the S&P 500 has rallied to a new all-time high, the 10-week moving average of the VIX has dropped more than 5%. Despite that drop, the VIX remains well off not only its 52-week low but even its 3-month low as well. That caused us to ponder some more.
Is it unusual to see the VIX so far above (i.e., more than 20%) its 3-month low with the S&P 500 at a 52-week high? As it turns out, it is fairly unusual, particularly over the past 15 years.
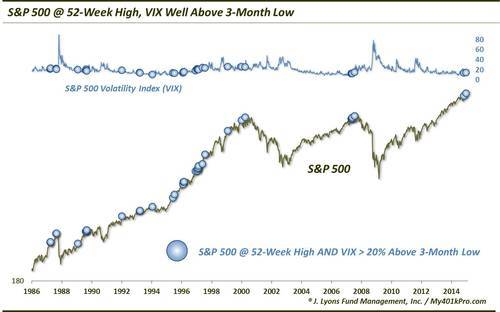
Since the VIX’s inception in 1986, there have been 37 weeks that saw it close more than 20% above its 3-month low while the S&P 500 was at a 52-week high, though many of those weeks were clustered together. And since 2000, this is essentially just the third unique occurrence.
The last 2 clusters took place at cyclical tops. The first saw incidents during the last week of 1999 as well as the very top in March 2000. The next cluster included a handful of weeks in April-May 2007 as well as the initial cycle top week in July 2007. We presumably don’t need to go into what happened following those occurrences. And as long as we are discussing disastrous results following this phenomenon, we’ll mention that it also occurred at the August 1987 top, preceding the October crash.
However, it has not always led to disaster. There was a string of occurrences during the mid-1990’s that did not lead to significant losses over any time frame. The bulk of these occurred in 1996 and 1997 when the market was emerging from arguably the lowest volatility period of all time, real and implied. Thus as the 1990’s bull market hit its acceleration phase in the latter half of the decade, it did so accompanied by a rising VIX.
We discussed this in the previous S&P 500-VIX standoff post. The rise in VIX during that time was not evidence of higher volatility up and down. Rather it was a sign of A) the end of the historic low-volatility period and B) the emerging higher upside volatility accompanying the accelerating rally.
Overall, here is the performance of the S&P 500 following all occassions since 1986 in which it closed at a 52-week high while the VIX was more than 20% above its 3-month low.
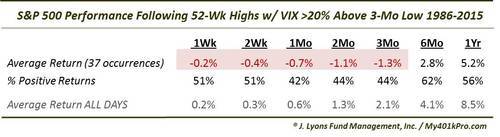
As the table shows, returns were poor, negative in fact, in the short to intermediate-term. By 6 months and a year out, however, returns recovered to at least respectable status, though still below typical. This suggests that, despite the occurrences at the 2000 and 2007 tops, this has been more of a warning in the short to intermediate-term. When it was a warning at all, that is. As we mentioned, during the mid-1990’s, this signal was triggered on numerous occasion without any ramifications. That, however, was due to the emergence from the historic low-volatility period.
We are loathe to subjectively exclude any market period from study results. However, the mid-1990’s volatility “regime change” was so unique that we feel it is at least worthwhile to display the returns from the table above without the 11 events that occurred in 1996 to 1997.
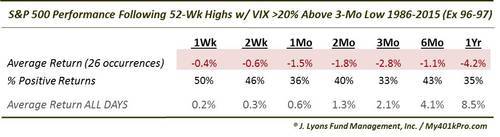
Again, for integrity purposes, it is not our preference to mine the results of our studies. However, it is our opinion that the unique circumstances of the mid-1990’s market mask the negative connotations suggested by this study. These circumstances have normally led to either a higher volatility and higher risk “regime change” or at least a temporary interruption in a bull market. Even during the rest of the 1990’s bull market, these signals led to short or intermediate-term market weakness. This is true of signals in 1992, 1993, 1994 and 1999.
So, with the S&P 500 at a high and the VIX well off of its lows, it appears we have another standoff. Factoring in how long it’s been since the VIX bottomed out, it is quite likely that we are undergoing a volatility regime change. The question is what type of regime is taking over? Are we entering a 1996-1997-type rising volatility/equity blowoff regime or a 2000/2007-type rising volatility/equity topping regime? The answer to that question will likely go a long way toward determining the winner of the S&P 500-VIX standoff.
________
“The Staring Contest” photo by Christopher Michel.
More from Dana Lyons, JLFMI and My401kPro.

