Unemployment Hits 6-Year Low; Bad News For Stocks?
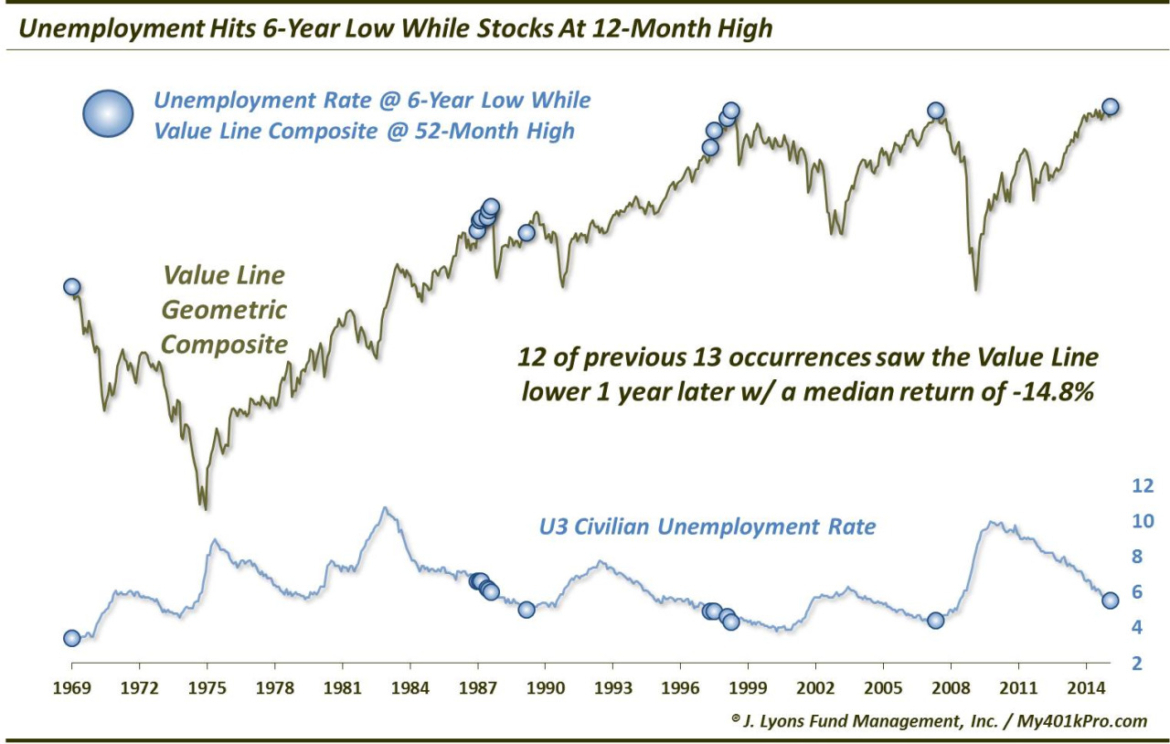
OK, before we get a barrage of hate mail, no, we do not think the drop in the unemployment rate is bad news. And no, we are not among the cadre of folks who – whether due to perma-bear status or simply a grumpy disposition – are always looking for the dark cloud in everything. We are simply intrigued by the quantitative aspects of the financial markets. And today’s Chart Of The Day reveals an intriguing piece of quantitative data:
Since 1969, when the U.S. U3 unemployment rate has hit a 6-year low while the stock market (as measured by the broad, equally-weighted Value Line Geometric Composite) is at a 12-month high, the market has been lower 1 year later 12 out of 13 times by a median -14.8%.
Again, do we think the drop in the unemployment rate is a bad thing? No. Do we think 6-year lows in the past have caused stock market corrections? No. Truth be told, it is probably just “one of those things”. However, there are likely a few messages worth considering here.
First, the historical market weakness following coincident 6-year lows in the unemployment rate and 12-month highs in the equity market probably speaks to the location in their respective cycles. That is, rather than the notion that the U3 being at a low or the Value Line being at a high is a negative, the combination has historically occurred toward the end of an economic expansion and bull market cycle. Despite the weak nature of the post-2009 recovery, 6 years into an economic expansion is a pretty long way, historically speaking. And while the condition of the stock market being at a 12-month high is not by itself a negative, occurring 6 years into an expansion suggests some vulnerability to corrective action.
Second, bull markets do not end amidst bad news. Rather, they end when stocks fail to advance on good news. This chart is indicative of that. Flash back to the periods marked on the chart (e.g., 1969, 1987, 1989, 1998, 2007) and you will find mostly positive sentiment among consumers and investors. We are not foolish enough to make predictions about a top here in the equity market. Even if this were a genuine concern, rallies have at times persisted for several more months in the past before peaking. However, the sentiment situation, at least in the market, is certainly consistent with those prior periods of either complacency or downright euphoria.
This again is probably just one of those interesting market data quirks. The phrase “correlation does not imply causation” certainly applies here. However, we would not totally dismiss the potential message regarding the current proximity of the market cycle. And while the good news of low unemployment and high equity prices has brought understandable good cheer, that is always the case at the peak.
Just sayin.
________
More from Dana Lyons, JLFMI and My401kPro.
The commentary included in this blog is provided for informational purposes only. It does not constitute a recommendation to invest in any specific investment product or service. Proper due diligence should be performed before investing in any investment vehicle. There is a risk of loss involved in all investments.


