Despite Dow’s Big Up Day, More Volume In Declining Issues

In a February 27 post (Heavy Selling For Such A Small Loss), we noted that despite a minuscule decline in the S&P 500 the prior day, there was actually twice as much volume in NYSE declining issues as there was in advancing issues. Yesterday saw a related phenomenon. While the Dow Jones Industrial Average (DJIA) gained a hefty +0.78% on the day, there was actually more volume in declining stocks on the NYSE than in advancing stocks. Like the February 27 post, this has been a rare occurrence. Also like the February 27 post, it has not been a good sign for stocks in the short-term.
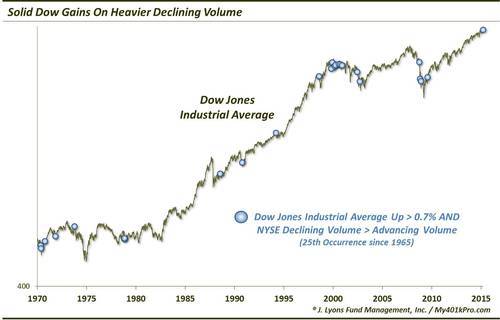
Here is a chart of all such occurrences since 1965.
Some context to this occurrence:
- Yesterday was just the 25th time in 50 years in which more volume on the NYSE was in declining issues than advancing issues on a day in which the DJIA rose at least +0.7%. That’s 25 times out of 2440 days (or about 1%) that saw the DJIA gain +0.7%.
- Furthermore, since 1965, there have been approximately 400 days in which the DJIA rose between +0.65% and +0.75%. The median disparity between NYSE advancing volume and declining volume on those days was 213% in favor of advancing volume. In other words, most days in the past 50 years that saw similar gains in the DJIA as yesterday actually contained twice as much advancing volume as declining volume on the NYSE.
As we mentioned, the DJIA’s performance following previous occurrences was poor, at least in the short-term.
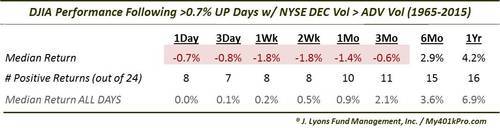
Median returns out to 3 months were negative. The very short-term, from 1 day to 2 weeks saw the weakest performance with no better than a third of such days showing positive returns. After 3 months, returns started to come back in line with typical returns. So, like the February 27 post, whatever negative ramifications were from these days seemed to be limited to the short-term.
We will note that many of these such bad-volume DJIA rallies occurred within “bad” markets, such as 1970, 1973, 1990, 2000, 2002 and 2008. By that we mean within the context of larger scale selloffs. Many of the instances, thus, were oversold, poor-volume “dead-cat bounces”. That is not the case here, at least in the bigger picture, as the DJIA closed within 2% of its all-time high yesterday. In fact, yesterday marked the closest proximity to the DJIA’s 52-week high of all 25 days in the study. Only 3/18/1994 and 11/22/1999 were anywhere close, both at 2.1% from the high. For what it’s worth, each instance was followed by weakness for at least 3 months. However, we probably cannot reasonably make a determination on the significance of the DJIA’s proximity to its 52-week high, vis-a-vis yesterday’s unusual phenomenon.
We often point out our belief in the importance of breadth in the market. The more stocks that are advancing the better. It also applies, to an extent, to volume breadth, as we discovered in this study. Historically the DJIA has consistently displayed short-term weakness following days in which it rallied at least +0.7% with more volume occurring in declining issues on the NYSE than in advancing issues. Therefore, we would label this another possible short-term headwind for the market.
________
More from Dana Lyons, JLFMI and My401kPro.
The commentary included in this blog is provided for informational purposes only. It does not constitute a recommendation to invest in any specific investment product or service. Proper due diligence should be performed before investing in any investment vehicle. There is a risk of loss involved in all investments.


