Should Investors Really Be Wary Of The Ides Of March?

The “Ides of March” corresponds to March 15th in the Roman calendar. The term became popularized in Shakespeare’s play “Julius Caesar” in which the emperor was forewarned by a soothsayer of his assassination on that date. It seems as though modern day “soothsayers” have become fond of issuing similar warnings as it pertains to the stock market. But is there any evidence backing up such warnings pertaining to the fate of stocks in the month of March in general? Our suspicion is that perhaps much of the popularity in such warnings stems from A) the attraction of the term itself and B) the top in 2000. Because based on historical evidence, outside of 2000, there has not been a whole lot to be wary of when it comes to the stock market in the month of March.
Since 1900, there has been just 1 other year in which the S&P 500/Composite formed a 12-month top during the month of March: 1923. Using the Dow Jones Industrial Average, we also get a top in 1937, although in 2000, the Dow topped in January so using either index yields just 2 12-month tops in the month of March over the past 115 years. Thus, by that criteria, perhaps the 2000 experience is still haunting investors…or pundits.
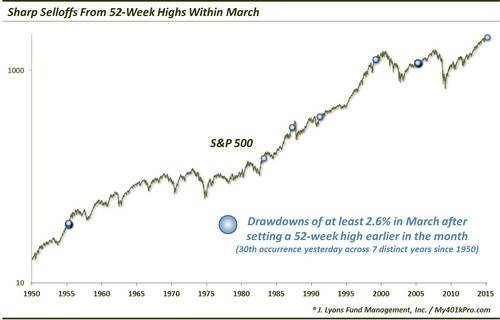
Moving to the source of much of the current angst regarding the Ides of March does not find any more evidence to be wary of. With stocks dropping precipitously over the past 10 days, alarm bells have been going off across Wall Street. After closing at an all-time high on March 2, the S&P 500 is now off those highs by -3.5% However, again, similar historical declines within March have tended to be buying opportunities rather than the start of something more ominous.
Specifically, this is what we looked at: all times since 1950 in which the S&P 500 closed at a 52-week high in March, then subsequently dropped during the month by at least -2.6% from that high. Yesterday marked just the 30th such day meeting that criteria.
The S&P 500’s performance following these days was, for the most part, very positive across all time frames. 23 of the 29 days saw the index higher 1 week later by an impressive median return of 1.4%. By the 1 month mark, the number of positive returns had dropped to 16. However, the gainers were especially strong as evidenced by a median return of 3.1%. And over the intermediate-term, the returns were exceptional. Every single one of the 29 days showed a positive return 3 months and 6 months afterward, with median returns of 5.1% and 5.7% respectively. Here is a table of the performance.
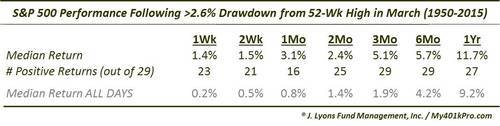
At the 1-year mark, only 2 of the occurrences saw the S&P 500 lower. Both of those days were in 1987. It is interesting that even those 1987 dates had positive 6-month returns as of September, just prior to the crash.
Now to be fair about the representation of this study, a majority of the instances (22, in fact) occurred during 2 years, 1955 and 2005. The others occurred in 1983, 1987, 1991, 1999 and now this year. If we look at simply the first occurrence within each of those years in which the S&P 500 had dropped over -2.6% from a 52-week high in March, we get the following results.
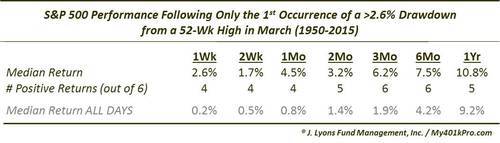
While the first table was overloaded with days from 1955 and 2005, using just the first instance during all years still yields very positive results. Obviously, the very small sample size may mitigate one’s reliance on the study, although there is likely to be only 1 possible occurrence per year.
Also to be fair, we cherry-picked the -2.6% drawdown level. Using the current drawdown level as of yesterday of -3.46% would have excluded the years 1983 and 1991. Therefore, widening the net increased the sample size by adding 2 years. That said, we cut the “net” off at -2.6% due to the -2.59% drawdown in 2000. Obviously, the 2000 instance was followed by losses over every time frame after 1 week. On the other hand, had we expanded the net down to a -2% drawdown, the study would have added occurrences in the years 1959, 1972 and 2012, all of which were followed by positive returns over almost every time frame.
The point is, we had to cut off the drawdown at some level. And no matter what the cutoff level was, the results perhaps simply lead us back to the point that, in the past 65 years, 2000 was the only year that saw a major top in March.
There are without a doubt a lot of valid reasons to be worried about the current state of the stock market. We have ourselves recited a litany of longer-term concerns that we have. However, based on historical evidence, these concerns do not include anything ominous surrounding the Ides of March, or any other day during the month.
__________
“julius caesar” photo by Jonte.
More from Dana Lyons, JLFMI and My401kPro.
The commentary included in this blog is provided for informational purposes only. It does not constitute a recommendation to invest in any specific investment product or service. Proper due diligence should be performed before investing in any investment vehicle. There is a risk of loss involved in all investments.


