Should You Break Up With Stocks?

In a February 9 post titled Seasonal Trend Says Date This Market, Don’t Commit, we looked at historical market tendencies when a weak January was followed by a strong first week of February. As the title suggests, we found that it was customary for the stock market (as measured by the Dow Jones Industrial Average since 1900) to continue its strength through February then turn weaker through the end of the year. Of course, this pattern did not transpire during every single one of those such years. However, overall, the median return for the DJIA over the remainder of February was +1.2% while the median return over the rest of the year was -1.1%. Well, the first tendency, i.e., continued strength through February, played out this year again. Today, we take a deeper look into the market’s second tendency to show weakness into year-end.
First off, the criteria: we are looking at all years during which the Dow Jones Industrial Average was down at least 1% in January then up at least 1% in February. Since 1900, there have been 15 such years.
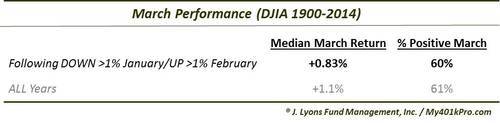
Looking first at historical returns over the following month, i.e., March, we find some good news. Of those 15 years, 9 showed a positive return in March. 6 of the years were up at least 3% although 2 of the years, both in the 1930’s, were down at least 10%. Overall, those 15 March’s showed a median return of +0.83%. That looks pretty good, although it becomes less impressive when considering the median return for all March’s is +1.10%. Here are the stats for March of those 15 years.
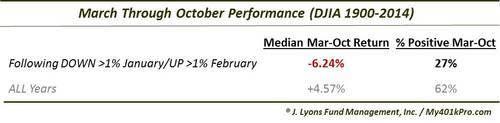
Whatever good news that is embedded in the March figures unfortunately ends there. We already knew, based on the February 9 post, that the returns through year-end were not going to look too good. And as it turns, on a monthly closing basis, March actually marks the median high point for the rest of the year during the 15 years meeting our criteria. The low point, on a median monthly closing basis, during those 15 years occurred in October, at -6.24%. Furthermore, just 4 of those 15 years saw a positive return from March through October. Here are the sobering figures for that period.
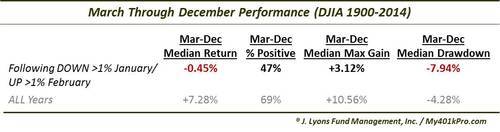
Obviously if October marked the low point during these years, the returns through December improved from the median -6.24% at the end of October. Indeed they did rebound strongly, nearly reaching the break-even mark, at -0.45%. 7 of the 15 years showed positive returns from March through December.
As the median high and low points in March and October would suggest, the risk to reward ratio during these years was not too favorable. We can see that as well by measuring the median maximum gain and maximum drawdown through the end of the year. On a monthly closing basis, the median maximum gain from March through December during the 15 years was +3.12% while the median maximum drawdown was -7.94%. So we’re looking at a risk:reward ratio of more than 2:1 to the down side, not what an investor wants to see. This is in especially stark contrast to the well over 2:1 upside from March through December during all years. Here are the statistics through year-end.
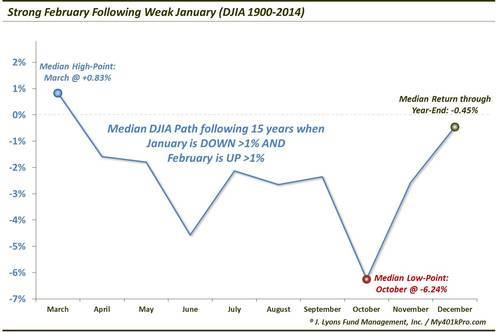
Graphically, here’s what the median path of the Dow Jones Industrial Average looks like for all 15 years that saw a 1% down January and a 1% up February.
Our February 9 post presented data that suggested investors “date the market but don’t commit”. This referred to the historical tendency for the Dow Jones Industrial Average to demonstrate continued strength through February following a combination of a weak January and a strong first week of February. Strength in the DJIA did indeed persist as the index closed up more than 5% for the month. That post also pointed out that the historical tendency was for weakness over the remainder of the year, thus the “don’t commit” portion.
Today’s study into weak January’s followed by strong February’s reinforces that year-end notion. To the extent that we can rely on historical seasonal patterns, these circumstances suggest caution over the remainder of the year, especially through October. With a risk reward of 2.5:1 to the downside through the end of the year, traders who “dated” stocks through February might consider “dumping” them in March.
________
More from Dana Lyons, JLFMI and My401kPro.
The commentary included in this blog is provided for informational purposes only. It does not constitute a recommendation to invest in any specific investment product or service. Proper due diligence should be performed before investing in any investment vehicle. There is a risk of loss involved in all investments.


