“Smart Money” Indicator Most Bearish In 16 Years

Most of the volume data (i.e., Put/Call ratios) that we look at from the equity options market are best utilized on a contrarian basis. That is, one should do the opposite of what the crowd is doing. Over the long-run, the crowd is invariably wrong at key turning points in the market, thus it pays to be a contrarian. (To emphasize, we are only referring to extremes in investment positioning. During a trend, as such positions are being built up, one is better served by following the trend.) There are a few select groups, however, that have historically been considered “smart money” due to their propensity to be correctly positioned at extremes. One example of such a group is the collection of traders of S&P 100 (OEX) options. If they are indeed smart money, their current behavior is a concern as they are presently in a bearish position of historic proportions.
Open interest refers to options positions that are still active, i.e., that have not been closed out yet. Over the past week, the level of OEX open interest in Puts versus Calls has surpassed anything seen in the past 16 years.
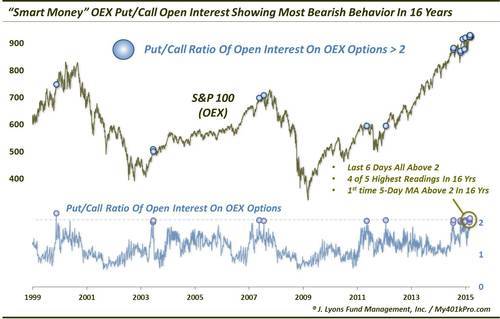
Historically, it has been rare to see twice as much open interest in OEX Puts as Calls. From 1998 through 2013, there were a total of 7 days that saw that Put/Call ratio above 2. In 2014, more readings began to pop up. From July through the end of the year, there were 8 total readings above 2. The past several days have seen that trend accelerate even further. Consider the following:
- Each of the past 6 days have seen the Put/Call Ratio of OEX open interest > 2.
- The 4 highest readings of the past 15 years all occurred within the past 6 days.
- The 5-day moving average of the Put/Call ratio reached > 2 for the first time in the last 16 years.
So based on history, is this historic cluster of high readings really something to be concerned about? Well, there is evidence from prior readings that would suggest the OEX traders have earned their “smart money” moniker.
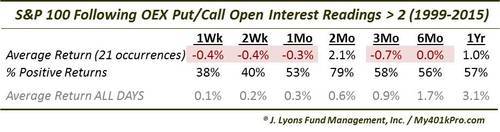
After prior readings, average returns were negative from 1 week out to 6 months, except for the 2-month time frame. The majority of the 1 to 3-month positive returns came following the readings in 2014. Therefore, one could argue that in the present environment, these readings are not as valid. That would be overstating it, however. 5 of the 8 readings in 2014 did show losses 2 and 3 weeks later of -1% to -5%. Therefore, it has still been a short-term thorn in the recent period, even if not a longer-term warning.
However, we would argue that is is much too soon to pass judgement on the indicator’s contemporary relevance on the intermediate to longer-term time frame. It is also possible that the recent period is an outlier and the piper will be paid eventually, as it has over the past decade and a half. A look at the dates of the prior occurrences reveals some inauspicious periods. They include November 1999, June 2003, February-July 2007, May 2011 and January 2012. Of those, only the 2012 occurrence did not result in considerable market struggles at some point during at least the first few months.
Due to the results over the past 8 months, we can accept that elevated readings of the OEX open interest Put/Call ratio suggest negative connotations for just the short-term. However, given both its more extensive history as well as the obscene extent of its present behavior, we can’t help but wonder if there will eventually be longer-term ramifications as well.
________
“stairs with a warning” photo by shino.
More from Dana Lyons, JLFMI and My401kPro.
The commentary included in this blog is provided for informational purposes only. It does not constitute a recommendation to invest in any specific investment product or service. Proper due diligence should be performed before investing in any investment vehicle. There is a risk of loss involved in all investments.


