This shift in a Smart Money indicator may be negative for stocks

The theory goes that trading done in the stock market early in the day is indicative of the eager and emotional “dumb money” reacting to developments occurring since the prior day’s close. Conversely, trading during the final hour of the day is representative of the more deliberate and calculating “smart money” traders. While there is certainly no way to prove (or disprove) this notion, taking measure of the early and late-day trading patterns can elicit some interesting observations, present circumstances included.
One researcher that tracks such data is Jason Goepfert at Sentimentrader.com. Goepfert subtracts the day’s change in the S&P 500 after the first half hour of trading and adds the change that occurs in the final hour of trading. He then tracks the cumulative running tally of the daily readings in what he calls the “Smart Money Indicator” (SMI). The SMI is exhibiting some interesting behavior currently. After generally trending lower since the March 2009 stock market low, and in particular during the relentless rally since 2012, the SMI has begun to curl upward. This is noteworthy since we saw the same behavior near the cyclical tops in 2000 and 2007.
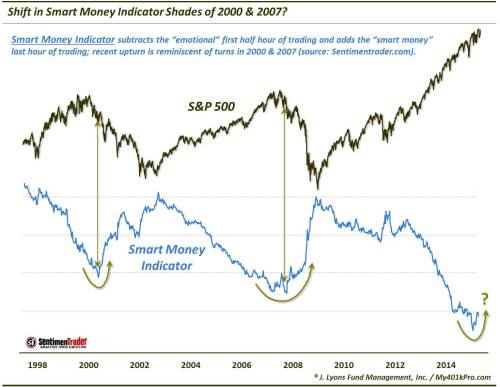
You might be thinking “shouldn’t the Smart Money Indicator trend upward during bull markets and downward during bear markets?” The main culprit here is likely the effect of opening gaps. Since the day’s change after the first half hour is subtracted from the SMI, gaps up to begin the day (unless completely unwound by the end of the first half-hour) would negatively impact the SMI. And big gaps up, and/or a lot of them, would contribute to a declining SMI even as the market is rallying. Conversely, persistent gaps down would contribute to a rising SMI.
Whatever the case may be regarding the mechanics of the SMI, a glance at the chart indicates that its behavior over the past 15 years is pretty straightforward. The major inflection points have occurred near significant tops and bottoms in the S&P 500. Lows in the SMI occurred at the end of 2000 and the end of 2007, just as the stock market was entering into cyclical bear markets. A potentially similar low occurred at the end of 2014. There appears to be a seasonal effect perhaps considering those turns occurred right at year-end. However, that effect has not been evident every year, only in 2000, 2007 and, ominously, 2014.
There is no guarantee that the developing shift in the Smart Money Indicator will continue higher. Indeed, we discussed a potential turn in July which did not follow through. This recent turn, however, is much more dramatic and convincing. If this move in the SMI does follow the course of its predecessors in 2000 and 2007, this could be a negative development for stocks.
__________
“A Minute to Midnight” photo by Mohammad Irteza Khan.
More from Dana Lyons, JLFMI and My401kPro.
The commentary included in this blog is provided for informational purposes only. It does not constitute a recommendation to invest in any specific investment product or service. Proper due diligence should be performed before investing in any investment vehicle. There is a risk of loss involved in all investments.


