A Few Twists To The “Sell In May” Phenomenon

If you follow the stock market closely, you are no doubt aware of the “Sell in May and Go Away” adage. If not, you will likely be inundated with the theme over the next few days. This is our contribution. So what is the idea behind the “Sell In May…” phenomenon? It simply refers to the stock market’s historical tendency to under-perform during the May through October period, and thus, out-perform from November through April. Some of these old market adages hold little or no benefit for investors but have seemingly stuck around merely because they have a catchy name. However, some have stood the test of time because, well, they have actually been consistently effective. “Sell In May and Go Away” falls in the latter category.
So, statistically, how much of an advantage does the November-April period have over the May-October period? Well, since 1900, these are the average returns of the Dow Jones Industrial Average (DJIA) for both of the 6-month periods:
- November-April returns have averaged +5.34%, with 68% positive returns
- May-October returns have averaged +1.67%, with 62% positive returns
In case that does not impress people, consider this:
- $10,000 invested only during May-October periods since 1900 would have grown to $64,980.
- $10,000 invested only during November-April periods since 1900 would have grown to $3,573,094.
So the adage, while often panned by market pundits does actually have the statistical chops to back it up.
Recently, we took a look at the “Sell In May” phenomenon from a few different angles to see if there were any factors either boosting those May-October periods, historically, or dampening them even further. One factor we looked at was the Presidential Cycle. As we have posted many times, this cycle refers to the market’s tendency to out-perform during certain parts of a President’s 4-year term and under-perform at other times. We wondered if the cycle had had any effect on the “Sell In May” phenomenon depending on the year. Relevant to now, we wanted to know the impact during Year 3′s. Here are the results since 1900 in the DJIA:
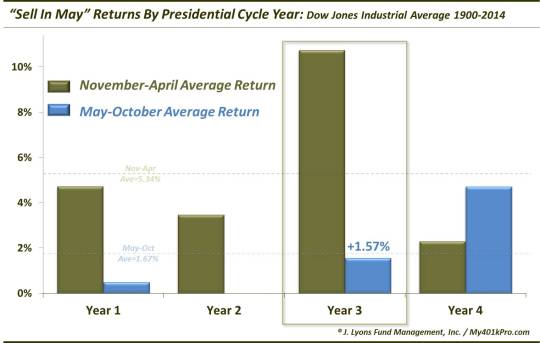
Well, as you can see from the chart, historically speaking, the average May-October return during Year 3′s has been +1.57%, almost exactly in line with the average of all years. So, not very helpful (by the way, considering the Year 4 returns, we’ll have to revisit this next year.)
Another angle we took to the “Sell in May” phenomenon was based on the DJIA’s returns during the 6 months preceding the period, i.e., November-April. This look revealed some interesting observations:
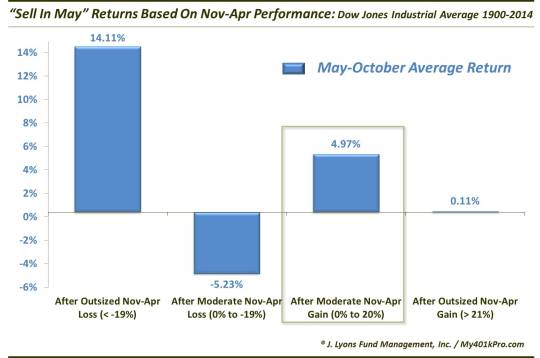
We broke the data down into years during which the DJIA suffered an outsized loss (i.e., worse than -19%) during November-April period, a moderate loss (0% to -19%), a moderate gain (0% to +20%) or an outsized gain (> 21%). By far the best May-October gains came following a big November-April loss. Conversely, the worst losses came after moderate losses during November to April. As it stands now, the current November-April period is going to come in at a moderate gain. Based on historical trends, this would bode well for the upcoming 6-month period as the average gain following moderate November-April gains is +4.97%. That is almost exactly triple the average of all May-October periods.
We tried to come up with a few different angles to the “Sell In May And Go Away” seasonal trend. Historically, the average 6-month period from May through October has badly lagged behind the November-April period. Adding the consideration of the Presidential Cycle Year 3 to the mix did not result in a material change in the average return. However, the fact that we are now finishing up the November-April period with moderate gains would seem to bode well for stocks since it has led to returns that were three times better than all years.
All this said, it is best to remember that these seasonality-type tendencies are merely generalities based on many years of market history. During any given year, returns might be far better or worse than the long-term average. Therefore, the “Sell In May And Go Away” adage should only be treated as a slight headwind for the market over the next 6 months. Although, given the returns following moderate gains over the preceding 6 months (as in our present situation) perhaps that slight headwind has been neutralized.
_____________
More from Dana Lyons, JLFMI and My401kPro.
The commentary included in this blog is provided for informational purposes only. It does not constitute a recommendation to invest in any specific investment product or service. Proper due diligence should be performed before investing in any investment vehicle. There is a risk of loss involved in all investments.


