Despite Range Bound Market, Stock Volatility Expanding

In a post last week, we discussed the recent uptick in stock market volatility as measured by the number of 1% up and down days occurring. The context was that transition phases, i.e., tops and bottoms, typically exhibit a relative increase in volatility (within an absolute low-volatility climate at tops and high-volatility climate at bottoms). Today, we take a look at the topic from another angle. Daily Average True Range (ATR) is another way of measuring volatility that looks at either the range from a day’s high to its low or from the previous day’s close to today’s high or low. When the ATR is expanding, volatility is expanding. That has been the case in recent months, which by itself is not unusual. What is unusual is that the Average True Range has been expanding even though the stock market has remained range bound.
Specifically, on several occasions over the past few months, we have seen the ATR rise by varying degrees over a 1-month period even though the S&P 500 failed to make either a 3-month high or a 3-month low during that time. This has been a fairly uncommon occurrence, particularly with the S&P 500 so close to its 52-week high.
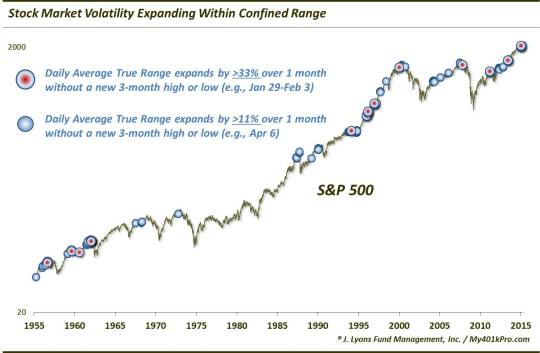
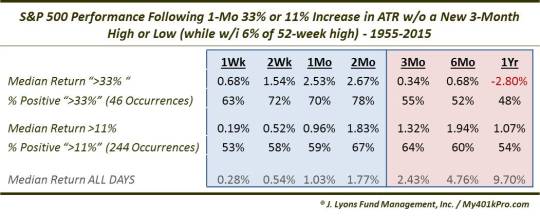
As of last Monday, the Daily Average True Range on the S&P 500 had risen 11% month-over-month, yet the index had not hit either a 3-month high or low during that time. Since 1955, there have been 244 days – or an average of 4 per year – that met that criteria when the index was within 6% of its 52-week high. Back in late January and early February, we saw a similar situation but with a monthly rise of more than 33% in the ATR. That has only occurred on 46 occasions now since 1955.
So we can see we have an unusual setup here in the market, with increasing volatility, yet the inability of that volatility to contribute to either a breakout or a breakdown out of the recent trading range. While we aren’t going to attempt to predict the direction of resolution to this range, history – and physics – suggests the range break should be a forceful one. Consider a laser for a moment. In a laser, light is commonly amplified by directing it back and forth between mirrors within a small confine. This amplified light is then directed through a tight opening, resulting in a intense, high-energy beam. So it is with a tightly traded, yet volatile security or index. The break of the S&P 500 range should should occur with elevated force.
We don’t know which way it will break. Historically, however, it has leaned a particular way in these situations (before often reverting in the opposite direction). In the study last week on the abundance of 1% up and down days near highs, we found the S&P 500 had a tendency to exhibit subsequent weakness, at least in the shorter-term. There were several instances occurring near major tops, however, most of the consistent damage was done within the first few months. Today’s study finds somewhat contrasting results. Results over the near-term (out to 2 months) were generally better than average. However, the longer-term story was another matter.
While it is important to guard against developing any anchoring bias, it is perhaps at least noteworthy to consider the fact that the “strength followed by weakness” template has historically played out at several stock market tops of significance. We saw temporary breakouts fail, leading to substantial declines in 1961-62, 1968, 1972, 1987, 2000, 2007 and 2011. Of course, nothing is unanimous. There have also been a fair number of times when stocks broke the range to the upside and just kept climbing. However, there have been enough dubious or false breakouts to at least keep it in mind.
Like last week’s study on the increase in 1% up and down days, the rise in the S&P 500′s Average True Range is indicative of rising stock market volatility, albeit subtle. While it is certainly not conclusive, such rises in volatility near 52-week highs have at times accompanied transitional topping periods. The unusual thing about the present rise in volatility is that it comes even as the market has been range bound for some time. This suggests that, like an amplified laser beam directed through a small opening, the break of the recent range could be a forceful one. Importantly, given the pattern’s historical tendency, we must be on guard for a false initial move out of the range, especially if that move is higher.
________
Laser photo by -___-;.
More from Dana Lyons, JLFMI and My401kPro.
The commentary included in this blog is provided for informational purposes only. It does not constitute a recommendation to invest in any specific investment product or service. Proper due diligence should be performed before investing in any investment vehicle. There is a risk of loss involved in all investments.


