Home In The Range: A Rare Streak For The Dow

We’ve dedicated several recent posts to the narrow trading range that has characterized U.S. stocks of late. This will (likely) be the final one on the topic. Not because the range is on the verge of breaking, though, it probably is. It is simply that we have made our point – that stocks have been stuck within a tight band – and we don’t wish to belabor the point. However, the Dow Jones Industrial Average (DJIA) did hit a milestone yesterday that is so rare historically that we thought it was worth mentioning. It has now been 30 days since the index has made either a 1-month high OR a 1-month low. This is just the 8th such streak in the last 100 years.
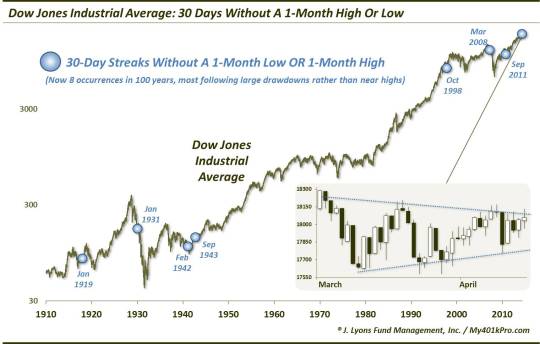
Obviously, 8 occurrences in 100 years constitutes a rare phenomenon. The DJIA actually once went 55 years (1943-1998) without one of these streaks. Here are the dates of the 8 historical streaks along with the number of days the streak would eventually reach.
- 1/9/1919 (36 days)
- 1/29/1931 (36)
- 2/5/1942
(31)
- 9/14/1943
(32)
- 10/13/1998
(31)
- 3/5/2008
(30)
- 9/21/2011
(30)
As you can see, most of the streaks ended within a few days. Only two of them (none since 1931) lasted more than 32. So if this current streak lasts beyond Monday, it would truly be historic.
What were the results of the streaks once they ended? To gain a proper perspective, it is probably appropriate to realize the context in which these streaks occurred. With a glance at the dates on the chart, you may note that our current streak is somewhat atypical compared with its predecessors. With the exception of the 1943 streak, each of these other streaks occurred following a significant drawdown in the DJIA (e.g.,10-20% losses). The streaks were a product of the DJIA attempting to form at least a short-term bottom following the selloff and a subsequent bounce.
So the prior streaks do not really mesh with our current setup given that the DJIA is within about 1% of its 52-week high. Even the 1943 instance saw the DJIA down about 5% from its high. Therefore, a comparison with the forward performance following these precedents doesn’t seem appropriate. For giggles, we will say that 5 of the 7 prior streaks did result in bounces of at least 6% over the next 2 months. The 1943 streak saw a smaller bounce of 3%. Only the 1942 streak failed to see any upside for 6 months. Longer-term, of note, the 1931, 1942 and 2008 occurrences would eventually continue their cyclical bear markets while the 1943, 1998 and 2011 occurrences would continue with their cyclical bulls.
If we widen the net a little bit, we can find a few more occurrences perhaps more akin to our present situation. In July 2003, the DJIA had a streak of 28 days without a 1-month high or low while it was less than 2% from a 52-week high. However, that market was coming off of a recent cyclical bear market low, similar to the 1943 occurrence.
Perhaps the streak of 26 days in March of 1965 was most close to the current streak. The DJIA at the time was in a multi-year bull market run. It consolidated very similarly to the present range before breaking out to the upside. After gaining about 3% in the next 2 months, the breakout failed and the index dropped 10% over the subsequent 2 months. While trying to avoid the “forecasting” this would seem to be a plausible scenario.
Whatever the eventual outcome of this range, it certainly is historic, particularly given the DJIA’s proximity to its 52-week high. Past precedents only give us general potential road maps, so when there are no real precedents, we are left without a map. Standard range trading rules would dictate waiting for the range to break and hopping aboard whichever direction the break occurred. However, anyone that has traded actively over the past several years knows that there have probably been as many false breakouts as legitimate ones. Therefore, the benefit of the doubt should lie with the overall trend, which remains up, until proven otherwise. Either way, the resolution of this range should at least provide some fireworks.
_____________
“Pronghorns with Wind River Mountain Range” photo by Tom Koerner.
More from Dana Lyons, JLFMI and My401kPro.
The commentary included in this blog is provided for informational purposes only. It does not constitute a recommendation to invest in any specific investment product or service. Proper due diligence should be performed before investing in any investment vehicle. There is a risk of loss involved in all investments.


