In The Presidential Cycle, April May Hold The Key For Year 3
On Tuesday, we discussed the likelihood of the stock market making a new high during the month of April. In this post, we show why it is potentially important for the market’s prospects that it do so. For centuries, observers have attempted to identify patterns, or cycles, occurring in market prices. In the U.S. stock market, perhaps the most widely cited cycle is the 4-year Presidential Cycle. As the name implies, the cycle has to do with the market’s behavior vis-a-vis the 4 years during a presidential term. Researchers have discovered that, for whatever reason, stocks tend to do better during some parts of the cycle and worse during others. And while that phenomenon may seem far-fetched to some, it has actually been one of the more consistent cycles in the market.
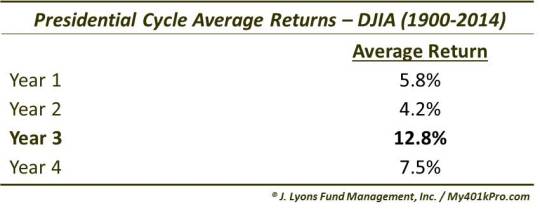
The most consistently strong year of the cycle is Year 3, which we are currently in. On average, Year 3 has offered the best average returns in the stock market. As measured by the Dow Jones Industrial Average since 1900, Year 3′s have averaged 12.8% returns, more than 5 percentage points better than the 2nd best year.
One of the more consistent trends of Presidential Year 3′s has been 1st quarter strength. Until this year, just 6 of the 28 Year 3′s since 1900 showed a loss for the 1st quarter. Thus, this year’s 0.3% loss in the DJIA, albeit small, was atypical.
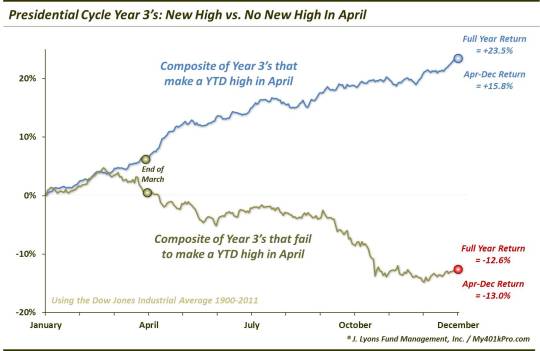
Speaking of the 1st quarter, when observing the data, one thing that stuck out to us was a phenomenon occurring around this time of year. For many of those Year 3′s that did not see positive results for the year, their “turn for the worse” happened around this time. In fact, one of the delineating factors separating the strong and weak Year 3′s seemed to be the performance in the month of April.
Specifically – on average – those Year 3′s that were able to make a new year-to-date high at some point in April continued to perform well over the duration of the year. Conversely, when the DJIA failed to make a new YTD high in April, those Year 3′s struggled the rest of the year, on average.
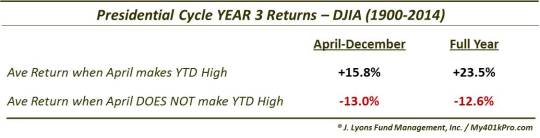
Here are the same numbers in table format.
In all investing, past performance does not guarantee future results. This is especially true with seasonality. Indeed, two recent Year 3′s, 1987 and 2011, each made new highs in April only to suffer crashes of varying magnitude later in the year. Additionally, while 2007 did show gains through year-end after making a new YTD high in April, it wasn’t exactly the most auspicious time to invest.
All told, however, those Year 3′s that made a new YTD high in April saw, on average, returns 36 percentage points better than those years that did not. Even from just April through December, the returns were nearly 30 percentage points better. Therefore, if 2015 is to follow the overall historical Year 3 pattern, bulls should hope for a new year-to-date high sometime this month.
________
More from Dana Lyons, JLFMI and My401kPro.
The commentary included in this blog is provided for informational purposes only. It does not constitute a recommendation to invest in any specific investment product or service. Proper due diligence should be performed before investing in any investment vehicle. There is a risk of loss involved in all investments.


