Less Than Meets The Eye In Nasdaq Rally?

It’s a day removed from Friday’s all-time high in the Nasdaq but we posted a couple Charts Of The Day today that had folks wondering if there was something about Friday’s action that suggested all was not well with the market despite the record highs. Well, yes and no. There was something unusual – actually two things – about Friday’s action that was certainly less representative of a healthy rally than the move in the Nasdaq 100 (NDX) would have one believe. However, whether or not this carries any negative significance going forward is debatable.
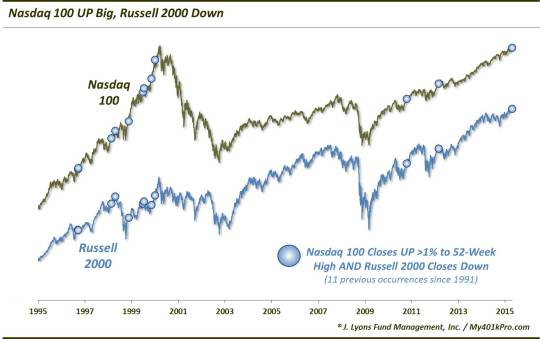
First, the unusual characteristics regarding Friday’s rally in the NDX. The first was that despite the 1.33% rally in the NDX to a 52-week high, the Russell 2000 small-cap average (RUT) actually closed down 0.31% on the day. This was just the 12th time since 1991 that the NDX rallied as much as 1% to a 52-week high on a day when the RUT closed down.

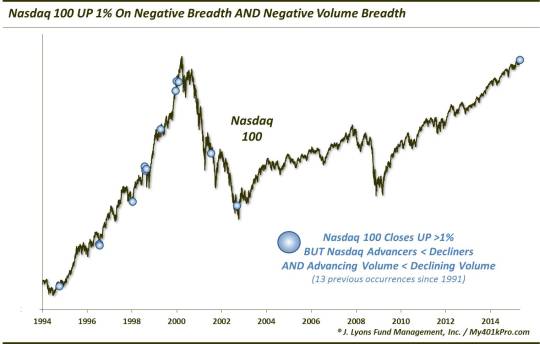
So despite the big up day in the big cap NDX stocks, there was no participation from the small cap area. As a good deal of these RUT stocks are listed on the Nasdaq exchange, there was also poor participation across the exchange as our second chart reveals. Again, despite the strong advance in the NDX, there were actually more stocks on the Nasdaq that declined on the day than advanced. Furthermore, there was also more declining volume on the exchange than advancing volume. This was an especially unusual occurrence as well.

As the chart indicates, this was just the 14th time since 1991 – and the first since 2002 – that the NDX rose by 1% on negative breadth and negative volume breadth. To give you an idea of how rare it has been, consider the fact that there have been a total of 1,416 days since 1991 that saw the NDX rally by as much as 1%. Less than 1% of those days had negative breadth and negative volume breadth. It hasn’t been that rare to see a +1% NDX day on just more decliners than advancers. However, to see more declining volume than advancing volume as well is odd since the 100 biggest stocks on the exchange, i.e., the NDX, typically command a large degree of the volume. Thus when the index is up significantly, the volume is typically skewed very positively as well.
So folks have been asking what the significance of these signs of poor participation might be on the market moving forward. Is it a 1-day fluke – or perhaps a sign of a narrowing of a rally in its latter stages? Well, based on historical precedent, there may be some cause for concern but, overall, it certainly doesn’t appear to be a sign of the Armageddon that some were wondering about.
Let’s start with the bad news. First, there was some evidence of short-term weakness, especially following the NDX-RUT divergence. Secondly, yes, there were some occurrences of these two phenomenons at or near intermediate to long-term peaks in the late-1990′s. Several occurrences of each came in 1998 preceding the correction that summer and fall. Additionally, there were a couple instances at the end of 1999 and beginning of 2000 which was of course in the lead up to the cyclical top. However, those readings came months before the actual market top so they were not necessarily timely warnings. Given the nature of those late 1990′s markets (i.e., large-cap tech stocks boomed while most stocks declined), it is not unexpected that we see many, or most, of the occurrences during that period.
The good news? Following the some short-term weakness, the aftermath of each phenomenon, in general, did not hinder intermediate-term returns. Outside of the 1998 occurrences and those around the turn of the century, the intermediate-term returns following these events were actually quite good. For example, on a 6-month time frame following the +1% NDX/negative breadth days, the NDX was higher 12 out of 13 times with an average return of +25%. And 6 months after the NDX-RUT divergence days, the NDX was higher all 11 times with an average return of 22%. Meanwhile, after some short-term weakness following the NDX-RUT divergence days, the Russell 2000 posted returns about on par with all days in the intermediate to longer-term.
Here are the performance statistics for each of the 2 studies.


Again, there is plenty to be concerned about in the market, if not immediately, at least in the longer-term. And while the unusual lack of participation, as evidenced by the weakness in the Russell 2000 and the Nasdaq breadth, on Friday’s big rally in the Nasdaq 100 is not a healthy sign, it is not necessarily a longer-term worry. Some weakness has followed such days historically in the short-term and thus, perhaps today’s market action should not be a surprise. However, there is little evidence from past occurrences that would suggest these developments have longer-term negative connotations. In fact, it has been the opposite. Now there were a few instances of these “weak” NDX rallies in late-1999 and early 2000 in the lead up to the cyclical top. This is again where the asymmetrical risks come in to play – if we are in such a period in the market. In that case, while poor returns are not typical, they are extreme in the magnitude of their weakness. However, while these low-participation rallies are certainly not “healthy”,
based on all of the historical evidence,
they do not appear to be symbolic of a late-stage thinning rally portending doom that some have wondered about.
_____________
More from Dana Lyons, JLFMI and My401kPro.
The commentary included in this blog is provided for informational purposes only. It does not constitute a recommendation to invest in any specific investment product or service. Proper due diligence should be performed before investing in any investment vehicle. There is a risk of loss involved in all investments.


