May Has Become The (short-term) “Toppiest” Month

Yesterday, we looked at the “Sell In May & Go Away” phenomenon, with a couple new twists. With many seasonality-type indicators or trends, it is common to see their effectiveness begin to wane over time. Traders begin to anticipate the seasonal trends and attempt to front-run them in order to get the edge. The more this occurs, the more the trend either shifts to occur earlier or occurs in such an expedited fashion that it is difficult to profit from it anymore. What makes the “Sell In May” phenomenon so unusual is that it has persisted, despite its broad awareness. And in fact, as today’s Chart Of The Day reveals, there are signs that the trend has actually grown stronger in recent years.
On several occasions in this space, we have posted charts showing the propensity of each calendar month to experience a top in the stock market, either on a short-term (i.e., 3 months) or a long-term (i.e., 12 months) basis. Here is a table showing the number of 3-month and 12-month tops made by the Dow Jones Industrial Average (DJIA)
in each particular month since 1900.
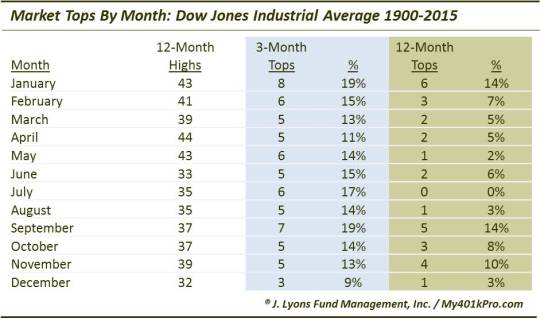
As the table shows, since 1900, the most prolific months for forming 12-month and 3-month tops are January and September. The month of May has had only 1 12-month top (1946) and is in the middle of the pack with 6 3-month tops in 115 years. However, viewing the timing of those 3-month May tops reveals something interesting. 4 of the tops have come just in the past 20 years (3 in the past 10 years alone).
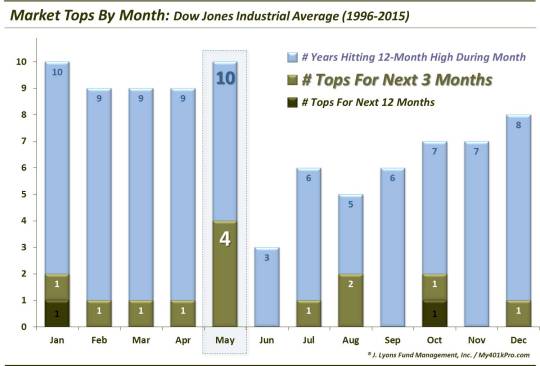
Over those 20 years, May’s 4 3-month tops are twice as many as any other month. August is the only other month with even 2 3-month tops over that period. The years of May’s 3-month tops were 1996, 2006, 2011 and 2012. (Incidentally, the only 12-month tops in the past 20 years in the DJIA were January 2000 and October 2007.)
Now there are a couple things to keep in mind here. First, this statistic is only relevant if the DJIA is able to rally back to a new high in May (the market can’t form a top if it’s not at a high.) Additionally, even if the DJIA does manage to hit a new high in May, it doesn’t mean that the odds are necessarily high that it will top out. Consider that 6 of the 10 times the DJIA hit a new high in May, it did not form a top. It’s like a .400 hitter in baseball – he may be the best, but he still fails more times than not.
However, in the past 20 years, the frequency of 3-month tops forming in May has significantly increased. And May’s propensity to form a short-term top is noticeably greater than any other month during that time. So while our first instinct when hearing something parroted incessantly among market observers – like “Sell In May” – is generally to run the other way, there certainly is statistical evidence to be cautious around this month. And when a trend persists in spite of its widespread awareness, it pays to at least give it some respect or consideration.
________
More from Dana Lyons, JLFMI and My401kPro.
The commentary included in this blog is provided for informational purposes only. It does not constitute a recommendation to invest in any specific investment product or service. Proper due diligence should be performed before investing in any investment vehicle. There is a risk of loss involved in all investments.


