Rise in Stock Volatility Near the Highs May Be a Red Flag

After opening significantly lower today following the weak jobs report on Friday, the stock market turned sharply higher, trading up close to 1% before fading slightly on the close. Such volatility has not been uncommon of late and makes today’s post especially relevant. It is widely known that volatility typically rises as the stock market declines. This is true of both volatility “expectations”, via volatility indexes like the VIX, as well as the actual volatility of prices. Prices are most volatile at market bottoms as large daily swings – both ways – are the norm during the transition as the market figures out which way it’s going to go. Conversely, volatility is normally depressed during advances in the stock market. However, during a topping transition phase, it is also common to see at least an increase in volatility, even if it is still low in absolute terms. It could be argued that we are seeing evidence of such a relative pickup in volatility now, even with prices near all-time highs.
Volatility expectations have been subtly on the rise. The S&P 500 Volatility Index (VIX) actually bottomed 9 months ago. Furthermore, the daily price moves in the market have been increasing of late – both ways. Though the S&P 500 is within a couple percentage points of an all-time high, it has been quite volatile. There have been 7 days over the past month in which it was up or down at least 1%. Even more extreme, in mid-February the S&P 500 closed at an all-time high on 2 occasions after closing 1% higher or lower 9 times during the prior month. As our Chart Of The Day points out, this type of volatility is rare for a market so close to its 52-week high.
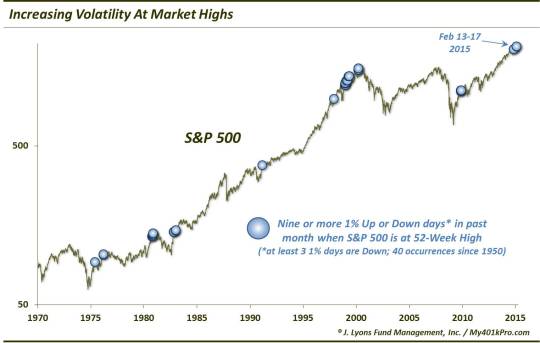
Since 1950 (chart starts in 1970), there have been just 40 days on which the S&P 500 closed at a 52-week high after having 9 daily changes of 1% or more over the prior month (with at least 3 of those days being down). For the sake of comparison, of all the days since 1950 that the S&P 500 closed at a 52-week high, the average number of 1% days (up or down) over the previous month was 2.5. The median was 2. The average number of 1% down days over the prior month was 0.6 and the median was 0. So that is an indication of just how volatile the recent period has been, comparatively speaking.
Again, this action can be symptomatic of a market in transition, i.e., a “topping” transition. Looking historically, this phenomenon has typically occurred during 1 of 2 types of market regimes:
- Either stocks were just emerging from a major selloff and these conditions triggered once the market was finally able to reach a 52-week high (e.g., 1975, 1982, 2009)…or
- The market was late in the bull cycle and this high volatility behavior was part of a topping transition process (e.g., 1976, 1980, 2000).
There were a few times this phenomenon occurred late in the bull market cycle but stocks were able to power through it. Not surprisingly, one of those periods was during the great bull market blowoff from 1997-1999. It also occurred on a handful of days last fall following the massive V-Bottom off the October lows. It is possible that we are still within the confines of that type of late-bull market action where weak internals and other red flags have little impact in the way of slowing down the major averages.
However, even some of those times when the market was able to eventually shake off such troublesome volatility and continue higher in the long run, it showed a pretty consistent tendency to suffer somewhat in the short to intermediate-term. Here is the S&P 500′s performance following all 40 of these high-volatility 52-week highs.
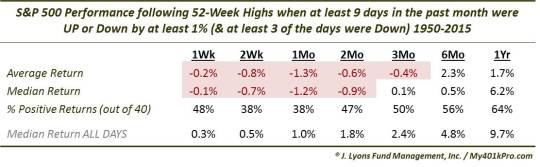
As the table shows, overall, the S&P 500 has turned in fairly weak performance in the short to intermediate-term, even considering the fact that many of the occurrences were not at market tops. You had to go out 6 months before the majority of the instances showed positive performance, and even then the median return was barely above zero. The most consistently weak duration was 3 weeks to 2 months afterward. The good news is that we are now about 6 weeks removed from those occurrences in February. So it is possible that the market has worked off most of the negative ill-effects from its “high-volatility” new high in February. The potential problem, however, is that the elevated volatility has remained despite the passage of time. So we’d certainly have a tough time signaling the “all clear” sign based on that.
Incidentally, we typically just include “median” returns in our performance tables as it is normally a more relevant measure than “average” return. It indicates the most typical outcome (at least based on what has occurred historically) rather than an average outcome that may be heavily skewed by just 1 or relatively few outlier results. However, in some cases, we believe it is appropriate to include the average as well, such as in this study. The reason is that the results are asymmetric. While the majority of occurrences did not mark tops, a not insignificant number (13) of them did. And the median 1-year return following those occurrences was -13%. Thus, the median 1-year return of 6.2% downplays the true risk in the longer-term. The average 1-year return of 1.7% probably more accurately portrays the true risk based off the historical precedents.
Like so many of our recent studies, it appears the key to unlocking the significance of this study in our current situation is determining the present market regime. Obviously, we are not emerging from a major market low. Therefore, we are likely either in a blowoff environment where these types of phenomena have no impact in slowing down the market…or we are in or nearing a topping transition phase. We don’t have the answer, but given the near 30-month relentless run higher by stocks it is tough to bet against them. Efforts in doing so have been rewarded during that time. However, the “topping” option cannot be dismissed entirely, if only due to the asymmetric risks involved in such a scenario.
________
Trampoline photo by Bobertson.
More from Dana Lyons, JLFMI and My401kPro.
The commentary included in this blog is provided for informational purposes only. It does not constitute a recommendation to invest in any specific investment product or service. Proper due diligence should be performed before investing in any investment vehicle. There is a risk of loss involved in all investments.


